404,95 €
404,95 €
inkl. MwSt.
Sofort per Download lieferbar
payback
202 °P sammeln
404,95 €
404,95 €
inkl. MwSt.
Sofort per Download lieferbar

Alle Infos zum eBook verschenken
payback
202 °P sammeln
Als Download kaufen
404,95 €
inkl. MwSt.
Sofort per Download lieferbar
payback
202 °P sammeln
Jetzt verschenken
404,95 €
inkl. MwSt.
Sofort per Download lieferbar

Alle Infos zum eBook verschenken
payback
202 °P sammeln
  • Format: PDF

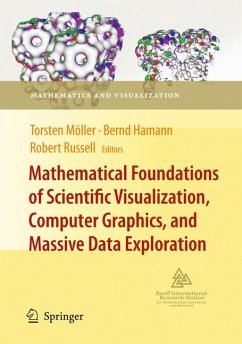
Visualizing the data is an essential part of any data analysis. Modern computing developments have led to big improvements in graphic capabilities and there are many new possibilities for data displays. This book gives an overview of modern data visualization methods, both in theory and practice. It details modern graphical tools such as mosaic plots, parallel coordinate plots, and linked views. Coverage also examines graphical methodology for particular areas of statistics, for example Bayesian analysis, genomic data and cluster analysis, as well software for graphics.

  • Geräte: PC
  • ohne Kopierschutz
  • eBook Hilfe
  • Größe: 36.12MB
Produktbeschreibung
Visualizing the data is an essential part of any data analysis. Modern computing developments have led to big improvements in graphic capabilities and there are many new possibilities for data displays. This book gives an overview of modern data visualization methods, both in theory and practice. It details modern graphical tools such as mosaic plots, parallel coordinate plots, and linked views. Coverage also examines graphical methodology for particular areas of statistics, for example Bayesian analysis, genomic data and cluster analysis, as well software for graphics.


Dieser Download kann aus rechtlichen Gründen nur mit Rechnungsadresse in A, B, BG, CY, CZ, D, DK, EW, E, FIN, F, GR, HR, H, IRL, I, LT, L, LR, M, NL, PL, P, R, S, SLO, SK ausgeliefert werden.

Autorenporträt
Chun-houh Chen, Academia Sinica, Taipei, Taiwan, China / Wolfgang Härdle, Humboldt-University of Berlin, Germany / Antony Unwin, University of Augsburg, Germany
Rezensionen
From the reviews:

"This handbook shows hundreds of ways to visualize data by using modern, high-quality statistical graphics. ... It is most enjoyable to see such a large number of specialists sharing their insights of these methods within one volume. This book really feeds the imagination of the reader. High-dimensionally recommended!" (Kimmo Vehkalahti, International Statistical Review, Vol. 76 (3), 2008)