37,95 €
37,95 €
inkl. MwSt.
Sofort per Download lieferbar
payback
19 °P sammeln
37,95 €
37,95 €
inkl. MwSt.
Sofort per Download lieferbar

Alle Infos zum eBook verschenken
payback
19 °P sammeln
Als Download kaufen
37,95 €
inkl. MwSt.
Sofort per Download lieferbar
payback
19 °P sammeln
Jetzt verschenken
37,95 €
inkl. MwSt.
Sofort per Download lieferbar

Alle Infos zum eBook verschenken
payback
19 °P sammeln
  • Format: PDF

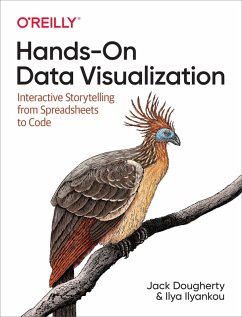
Tell your story and show it with data, using free and easy-to-learn tools on the web. This introductory book teaches you how to design interactive charts and customized maps for your website, beginning with simple drag-and-drop tools such as Google Sheets, Datawrapper, and Tableau Public. You'll also gradually learn how to edit open source code templates like Chart.js, Highcharts, and Leaflet on GitHub.Hands-On Data Visualization takes you step-by-step through tutorials, real-world examples, and online resources. This practical guide is ideal for students, nonprofit organizations, small…mehr

  • Geräte: PC
  • mit Kopierschutz
  • eBook Hilfe
  • Größe: 74.95MB
  • FamilySharing(5)
Produktbeschreibung
Tell your story and show it with data, using free and easy-to-learn tools on the web. This introductory book teaches you how to design interactive charts and customized maps for your website, beginning with simple drag-and-drop tools such as Google Sheets, Datawrapper, and Tableau Public. You'll also gradually learn how to edit open source code templates like Chart.js, Highcharts, and Leaflet on GitHub.Hands-On Data Visualization takes you step-by-step through tutorials, real-world examples, and online resources. This practical guide is ideal for students, nonprofit organizations, small business owners, local governments, journalists, academics, and anyone who wants to take data out of spreadsheets and turn it into lively interactive stories. No coding experience is required.Build interactive charts and maps and embed them in your websiteUnderstand the principles for designing effective charts and mapsLearn key data visualization concepts to help you choose the right toolsConvert and transform tabular and spatial data to tell your data storyEdit and host Chart.js, Highcharts, and Leaflet map code templates on GitHubLearn how to detect bias in charts and maps produced by others

Dieser Download kann aus rechtlichen Gründen nur mit Rechnungsadresse in A, B, BG, CY, CZ, D, DK, EW, E, FIN, F, GR, HR, H, IRL, I, LT, L, LR, M, NL, PL, P, R, S, SLO, SK ausgeliefert werden.

Autorenporträt
Jack Dougherty is a Professor of Educational Studies at Trinity College in Hartford, Connecticut. Professor Dougherty has taught data visualization to undergraduates at Trinity College and to thousands of participants in a global online course. He and his students have partnered with dozens of non-profit organizations, journalists, and researchers to help tell their data stories on the web. Ilya Ilyankou is an Independent Technologist. Ilya has been working with CTData Collaborative to build data visualization and data exploration tools for Connecticut for two years. He studied Computer Science and Studio Arts at Trinity College, Hartford.