Alle Infos zum eBook verschenken
- Format: ePub
- Merkliste
- Auf die Merkliste
- Bewerten Bewerten
- Teilen
- Produkt teilen
- Produkterinnerung
- Produkterinnerung
Hier können Sie sich einloggen
Bitte loggen Sie sich zunächst in Ihr Kundenkonto ein oder registrieren Sie sich bei bücher.de, um das eBook-Abo tolino select nutzen zu können.
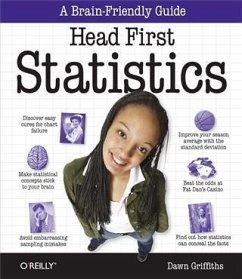
Wouldn't it be great if there were a statistics book that made histograms, probability distributions, and chi square analysis more enjoyable than going to the dentist? Head First Statistics brings this typically dry subject to life, teaching you everything you want and need to know about statistics through engaging, interactive, and thought-provoking material, full of puzzles, stories, quizzes, visual aids, and real-world examples.Whether you're a student, a professional, or just curious about statistical analysis, Head First's brain-friendly formula helps you get a firm grasp of statistics so…mehr
- Geräte: eReader
- mit Kopierschutz
- eBook Hilfe
- Größe: 24.6MB
- FamilySharing(5)
- Michael J. CrawleyStatistics (eBook, ePUB)31,99 €
- Dawn GriffithsHead First Statistics (eBook, PDF)24,95 €
- Alex ReinhartStatistics Done Wrong (eBook, ePUB)12,95 €
- Joseph TalStrategy and Statistics in Clinical Trials (eBook, ePUB)34,95 €
- Sarah BoslaughStatistics in a Nutshell (eBook, ePUB)23,95 €
- Sheldon M. RossIntroductory Statistics (eBook, ePUB)68,95 €
- Sheldon M. RossIntroduction to Probability and Statistics for Engineers and Scientists (eBook, ePUB)59,95 €
-
-
-
-
Dieser Download kann aus rechtlichen Gründen nur mit Rechnungsadresse in A, B, BG, CY, CZ, D, DK, EW, E, FIN, F, GR, HR, H, IRL, I, LT, L, LR, M, NL, PL, P, R, S, SLO, SK ausgeliefert werden.
- Produktdetails
- Verlag: O'Reilly Media
- Seitenzahl: 718
- Erscheinungstermin: 26. August 2008
- Englisch
- ISBN-13: 9781449331566
- Artikelnr.: 38310976
- Verlag: O'Reilly Media
- Seitenzahl: 718
- Erscheinungstermin: 26. August 2008
- Englisch
- ISBN-13: 9781449331566
- Artikelnr.: 38310976
- Herstellerkennzeichnung Die Herstellerinformationen sind derzeit nicht verfügbar.
2 Distribution: There's Something Going On...; 14.1 There may be trouble ahead at Fat Dan's Casino; 14.2 Let's start with the slot machines; 14.3 The
2 test assesses difference; 14.4 So what does the test statistic represent?; 14.5 Two main uses of the
2 distribution; 14.6 v represents degrees of freedom; 14.7 What's the significance?; 14.8 Hypothesis testing with
2; 14.9 You've solved the slot machine mystery; 14.10 Fat Dan has another problem; 14.11 the
2 distribution can test for independence; 14.12 You can find the expected frequencies using probability; 14.13 So what are the frequencies?; 14.14 We still need to calculate degrees of freedom; 14.15 Generalizing the degrees of freedom; 14.16 And the formula is...; 14.17 You've saved the casino; Chapter 15: Correlation and Regression: What's My Line?; 15.1 Never trust the weather; 15.2 Let's analyze sunshine and attendance; 15.3 Exploring types of data; 15.4 Visualizing bivariate data; 15.5 Scatter diagrams show you patterns; 15.6 Correlation vs. causation; 15.7 Predict values with a line of best fit; 15.8 Your best guess is still a guess; 15.9 We need to minimize the errors; 15.10 Introducing the sum of squared errors; 15.11 Find the equation for the line of best fit; 15.12 Finding the slope for the line of best fit; 15.13 Finding the slope for the line of best fit, part ii; 15.14 We've found b, but what about a?; 15.15 You've made the connection; 15.16 Let's look at some correlations; 15.17 The correlation coefficient measures how well the line fits the data; 15.18 There's a formula for calculating the correlation coefficient, r; 15.19 Find r for the concert data; 15.20 Find r for the concert data, continued; 15.21 You've saved the day!; 15.22 Leaving town...; 15.23 It's been great having you here in Statsville!; Leftovers: The Top Ten Things (we didn't cover); #1. Other ways of presenting data; #2. Distribution anatomy; #3. Experiments; Designing your experiment; #4. Least square regression alternate notation; #5. The coefficient of determination; #6. Non-linear relationships; #7. The confidence interval for the slope of a regression line; #8. Sampling distributions - the difference between two means; #9. Sampling distributions - the difference between two proportions; #10. E(X) and Var(X) for continuous probability distributions; Finding E(X); Finding Var(X); Statistics Tables: Looking Things Up; #1. Standard normal probabilities; #2. t-distribution critical values; #3. X2 critical values;