Sie sind bereits eingeloggt. Klicken Sie auf 2. tolino select Abo, um fortzufahren.
Bitte loggen Sie sich zunächst in Ihr Kundenkonto ein oder registrieren Sie sich bei bücher.de, um das eBook-Abo tolino select nutzen zu können.
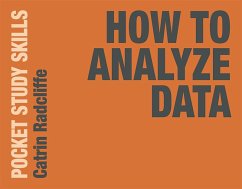
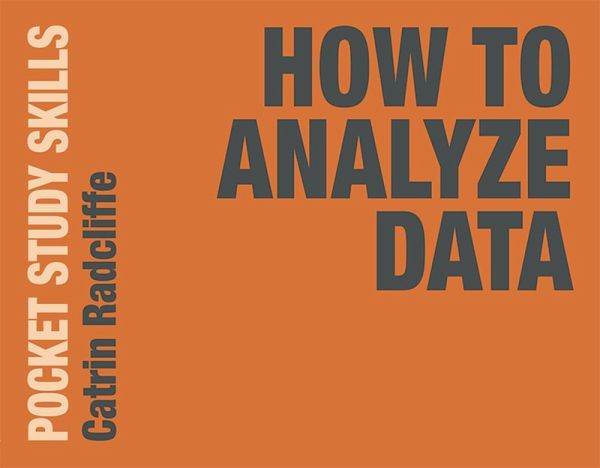
This accessible guide is an ideal starter for students who are puzzled by statistics and quantitative data analysis. Taking students step-by-step through the statistical process, it introduces the steps involved in successfully describing, analyzing and interpreting data and explains the logic which underpins these processes. Bite-sized chapters provide practical guidance for each stage of the process, from defining the research question and designing questionnaires through to using the appropriate statistical tests and analyses for the task and reporting and interpreting statistics. Clear…mehr
This accessible guide is an ideal starter for students who are puzzled by statistics and quantitative data analysis. Taking students step-by-step through the statistical process, it introduces the steps involved in successfully describing, analyzing and interpreting data and explains the logic which underpins these processes. Bite-sized chapters provide practical guidance for each stage of the process, from defining the research question and designing questionnaires through to using the appropriate statistical tests and analyses for the task and reporting and interpreting statistics.
Clear and concise, this will be a go-to resource for undergraduates of all disciplines who need to get to grips with basic statistics on their course.
Die Herstellerinformationen sind derzeit nicht verfügbar.
Autorenporträt
Catrin Radcliffe is a tutor of mathematics and statistics at Oxford Brookes University, UK.
Inhaltsangabe
Introduction PART 1: GETTING STARTED 1. What does your assignment ask you to do? 2. How will you do it? 3. Defining your research question 4. Tips for designing your questionnaire 5. How to enter your data into a spreadsheet PART 2: UNDERSTANDING AND DESCRIBING YOUR DATA 6. What type of data do you have? 7. Descriptive statistics 8. What plot should you use? PART 3: HOW DO STATISTICAL TESTS WORK? 9. What is a statistical hypothesis? 10. Using probability distributions in statistical tests 11. Statistics, "errors" and interpretation PART 4: WHAT STATISTICAL TEST DO YOU NEED? 12. The statistics signpost 13. Statistical flowcharts 14. Case studies PART 5: THE STATISTICAL PROCESS 15. You the researcher 16. You the interpreter Symbols explained Useful resources References Index.
Es gelten unsere Allgemeinen Geschäftsbedingungen: www.buecher.de/agb
Impressum
www.buecher.de ist ein Internetauftritt der buecher.de internetstores GmbH
Geschäftsführung: Monica Sawhney | Roland Kölbl | Günter Hilger
Sitz der Gesellschaft: Batheyer Straße 115 - 117, 58099 Hagen
Postanschrift: Bürgermeister-Wegele-Str. 12, 86167 Augsburg
Amtsgericht Hagen HRB 13257
Steuernummer: 321/5800/1497
USt-IdNr: DE450055826