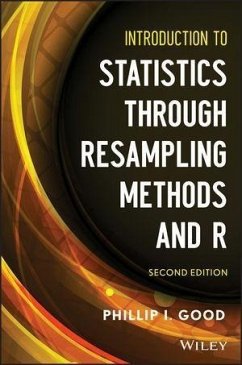
Introduction to Statistics Through Resampling Methods and R (eBook, ePUB)


Alle Infos zum eBook verschenken

Introduction to Statistics Through Resampling Methods and R (eBook, ePUB)
- Format: ePub
- Merkliste
- Auf die Merkliste
- Bewerten Bewerten
- Teilen
- Produkt teilen
- Produkterinnerung
- Produkterinnerung

Hier können Sie sich einloggen

Bitte loggen Sie sich zunächst in Ihr Kundenkonto ein oder registrieren Sie sich bei bücher.de, um das eBook-Abo tolino select nutzen zu können.
A highly accessible alternative approach to basic statistics Praise for the First Edition: "Certainly one of the most impressive little paperback 200-page introductory statistics books that I will ever see . . . it would make a good nightstand book for every statistician."--Technometrics Written in a highly accessible style, Introduction to Statistics through Resampling Methods and R, Second Edition guides students in the understanding of descriptive statistics, estimation, hypothesis testing, and model building. The book emphasizes the discovery method, enabling readers to ascertain solutions…mehr
- Geräte: eReader
- mit Kopierschutz
- eBook Hilfe
- Größe: 3.59MB
![Introduction to Statistics Through Resampling Methods and R (eBook, PDF) Introduction to Statistics Through Resampling Methods and R (eBook, PDF)]() Phillip I. GoodIntroduction to Statistics Through Resampling Methods and R (eBook, PDF)59,99 €
Phillip I. GoodIntroduction to Statistics Through Resampling Methods and R (eBook, PDF)59,99 €![An Introduction to Statistical Computing (eBook, ePUB) An Introduction to Statistical Computing (eBook, ePUB)]() Jochen VossAn Introduction to Statistical Computing (eBook, ePUB)67,99 €
Jochen VossAn Introduction to Statistical Computing (eBook, ePUB)67,99 €![Advanced Markov Chain Monte Carlo Methods (eBook, ePUB) Advanced Markov Chain Monte Carlo Methods (eBook, ePUB)]() Faming LiangAdvanced Markov Chain Monte Carlo Methods (eBook, ePUB)96,99 €
Faming LiangAdvanced Markov Chain Monte Carlo Methods (eBook, ePUB)96,99 €![Robust Statistics (eBook, ePUB) Robust Statistics (eBook, ePUB)]() Peter J. HuberRobust Statistics (eBook, ePUB)133,99 €
Peter J. HuberRobust Statistics (eBook, ePUB)133,99 €![Computational and Statistical Methods for Protein Quantification by Mass Spectrometry (eBook, ePUB) Computational and Statistical Methods for Protein Quantification by Mass Spectrometry (eBook, ePUB)]() Ingvar EidhammerComputational and Statistical Methods for Protein Quantification by Mass Spectrometry (eBook, ePUB)80,99 €
Ingvar EidhammerComputational and Statistical Methods for Protein Quantification by Mass Spectrometry (eBook, ePUB)80,99 €![Tree-based Graph Partitioning Constraint (eBook, ePUB) Tree-based Graph Partitioning Constraint (eBook, ePUB)]() X. LorcaTree-based Graph Partitioning Constraint (eBook, ePUB)139,99 €
X. LorcaTree-based Graph Partitioning Constraint (eBook, ePUB)139,99 €![Statistical Hypothesis Testing with SAS and R (eBook, ePUB) Statistical Hypothesis Testing with SAS and R (eBook, ePUB)]() Dirk TaegerStatistical Hypothesis Testing with SAS and R (eBook, ePUB)73,99 €
Dirk TaegerStatistical Hypothesis Testing with SAS and R (eBook, ePUB)73,99 €-
-
-
Dieser Download kann aus rechtlichen Gründen nur mit Rechnungsadresse in A, B, BG, CY, CZ, D, DK, EW, E, FIN, F, GR, HR, H, IRL, I, LT, L, LR, M, NL, PL, P, R, S, SLO, SK ausgeliefert werden.
Hinweis: Dieser Artikel kann nur an eine deutsche Lieferadresse ausgeliefert werden.
- Produktdetails
- Verlag: John Wiley & Sons
- Seitenzahl: 224
- Erscheinungstermin: 18. Dezember 2012
- Englisch
- ISBN-13: 9781118497579
- Artikelnr.: 37758647
- Verlag: John Wiley & Sons
- Seitenzahl: 224
- Erscheinungstermin: 18. Dezember 2012
- Englisch
- ISBN-13: 9781118497579
- Artikelnr.: 37758647
- Herstellerkennzeichnung Die Herstellerinformationen sind derzeit nicht verfügbar.
1. Variation 1
1.1 Variation 1
1.2 Collecting Data 2
1.2.1 A Worked-Through Example 3
1.3 Summarizing Your Data 4
1.3.1 Learning to Use R 5
1.4 Reporting Your Results 7
1.4.1 Picturing Data 8
1.4.2 Better Graphics 10
1.5 Types of Data 11
1.5.1 Depicting Categorical Data 12
1.6 Displaying Multiple Variables 12
1.6.1 Entering Multiple Variables 13
1.6.2 From Observations to Questions 14
1.7 Measures of Location 15
1.7.1 Which Measure of Location? 17
1.7.2 The Geometric Mean 18
1.7.3 Estimating Precision 18
1.7.4 Estimating with the Bootstrap 19
1.8 Samples and Populations 20
1.8.1 Drawing a Random Sample 22
1.8.2 Using Data That Are Already in Spreadsheet Form 23
1.8.3 Ensuring the Sample Is Representative 23
1.9 Summary and Review 23
2. Probability 25
2.1 Probability 25
2.1.1 Events and Outcomes 27
2.1.2 Venn Diagrams 27
2.2 Binomial Trials 29
2.2.1 Permutations and Rearrangements 30
2.2.2 Programming Your Own Functions in R 32
2.2.3 Back to the Binomial 33
2.2.4 The Problem Jury 33
2.3 Conditional Probability 34
2.3.1 Market Basket Analysis 36
2.3.2 Negative Results 36
2.4 Independence 38
2.5 Applications to Genetics 39
2.6 Summary and Review 40
3. Two Naturally Occurring Probability Distributions 43
3.1 Distribution of Values 43
3.1.1 Cumulative Distribution Function 44
3.1.2 Empirical Distribution Function 45
3.2 Discrete Distributions 46
3.3 The Binomial Distribution 47
3.3.1 Expected Number of Successes in n Binomial Trials 47
3.3.2 Properties of the Binomial 48
3.4 Measuring Population Dispersion and Sample Precision 51
3.5 Poisson: Events Rare in Time and Space 53
3.5.1 Applying the Poisson 53
3.5.2 Comparing Empirical and Theoretical Poisson Distributions 54
3.5.3 Comparing Two Poisson Processes 55
3.6 Continuous Distributions 55
3.6.1 The Exponential Distribution 56
3.7 Summary and Review 57
4. Estimation and the Normal Distribution 59
4.1 Point Estimates 59
4.2 Properties of the Normal Distribution 61
4.2.1 Student's t-Distribution 63
4.2.2 Mixtures of Normal Distributions 64
4.3 Using Confidence Intervals to Test Hypotheses 65
4.3.1 Should We Have Used the Bootstrap? 65
4.3.2 The Bias-Corrected and Accelerated Nonparametric Bootstrap 66
4.3.3 The Parametric Bootstrap 68
4.4 Properties of Independent Observations 69
4.5 Summary and Review 70
5. Testing Hypotheses 71
5.1 Testing a Hypothesis 71
5.1.1 Analyzing the Experiment 72
5.1.2 Two Types of Errors 74
5.2 Estimating Effect Size 76
5.2.1 Effect Size and Correlation 76
5.2.2 Using Confidence Intervals to Test Hypotheses 78
5.3 Applying the t-Test to Measurements 79
5.3.1 Two-Sample Comparison 80
5.3.2 Paired t-Test 80
5.4 Comparing Two Samples 81
5.4.1 What Should We Measure? 81
5.4.2 Permutation Monte Carlo 82
5.4.3 One- vs. Two-Sided Tests 83
5.4.4 Bias-Corrected Nonparametric Bootstrap 83
5.5 Which Test Should We Use? 84
5.5.1 p-Values and Significance Levels 85
5.5.2 Test Assumptions 85
5.5.3 Robustness 86
5.5.4 Power of a Test Procedure 87
5.6 Summary and Review 89
6. Designing an Experiment or Survey 91
6.1 The Hawthorne Effect 91
6.1.1 Crafting an Experiment 92
6.2 Designing an Experiment or Survey 94
6.2.1 Objectives 94
6.2.2 Sample from the Right Population 95
6.2.3 Coping with Variation 97
6.2.4 Matched Pairs 98
6.2.5 The Experimental Unit 99
6.2.6 Formulate Your Hypotheses 99
6.2.7 What Are You Going to Measure? 100
6.2.8 Random Representative Samples 101
6.2.9 Treatment Allocation 102
6.2.10 Choosing a Random Sample 103
6.2.11 Ensuring Your Observations Are Independent 103
6.3 How Large a Sample? 104
6.3.1 Samples of Fixed Size 106
6.3.1.1 Known Distribution 106
6.3.1.2 Almost Normal Data 108
6.3.1.3 Bootstrap 110
6.3.2 Sequential Sampling 112
6.3.2.1 Stein's Two-Stage Sampling Procedure 112
6.3.2.2 Wald Sequential Sampling 112
6.3.2.3 Adaptive Sampling 115
6.4 Meta-Analysis 116
6.5 Summary and Review 116
7. Guide to Entering, Editing, Saving, and Retrieving Large Quantities of
Data Using R 119
7.1 Creating and Editing a Data File 120
7.2 Storing and Retrieving Files from within R 120
7.3 Retrieving Data Created by Other Programs 121
7.3.1 The Tabular Format 121
7.3.2 Comma-Separated Values 121
7.3.3 Data from Microsoft Excel 122
7.3.4 Data from Minitab, SAS, SPSS, or Stata Data Files 122
7.4 Using R to Draw a Random Sample 122
8. Analyzing Complex Experiments 125
8.1 Changes Measured in Percentages 125
8.2 Comparing More Than Two Samples 126
8.2.1 Programming the Multi-Sample Comparison in R 127
8.2.2 Reusing Your R Functions 128
8.2.3 What Is the Alternative? 129
8.2.4 Testing for a Dose Response or Other Ordered Alternative 129
8.3 Equalizing Variability 131
8.4 Categorical Data 132
8.4.1 Making Decisions with R 134
8.4.2 One-Sided Fisher's Exact Test 135
8.4.3 The Two-Sided Test 136
8.4.4 Testing for Goodness of Fit 137
8.4.5 Multinomial Tables 137
8.5 Multivariate Analysis 139
8.5.1 Manipulating Multivariate Data in R 140
8.5.2 Hotelling's T2 141
8.5.3 Pesarin-Fisher Omnibus Statistic 142
8.6 R Programming Guidelines 144
8.7 Summary and Review 148
9. Developing Models 149
9.1 Models 149
9.1.1 Why Build Models? 150
9.1.2 Caveats 152
9.2 Classification and Regression Trees 152
9.2.1 Example: Consumer Survey 153
9.2.2 How Trees Are Grown 156
9.2.3 Incorporating Existing Knowledge 158
9.2.4 Prior Probabilities 158
9.2.5 Misclassification Costs 159
9.3 Regression 160
9.3.1 Linear Regression 161
9.4 Fitting a Regression Equation 162
9.4.1 Ordinary Least Squares 162
9.4.2 Types of Data 165
9.4.3 Least Absolute Deviation Regression 166
9.4.4 Errors-in-Variables Regression 167
9.4.5 Assumptions 168
9.5 Problems with Regression 169
9.5.1 Goodness of Fit versus Prediction 169
9.5.2 Which Model? 170
9.5.3 Measures of Predictive Success 171
9.5.4 Multivariable Regression 171
9.6 Quantile Regression 174
9.7 Validation 176
9.7.1 Independent Verification 176
9.7.2 Splitting the Sample 177
9.7.3 Cross-Validation with the Bootstrap 178
9.8 Summary and Review 178
10. Reporting Your Findings 181
10.1 What to Report 181
10.1.1 Study Objectives 182
10.1.2 Hypotheses 182
10.1.3 Power and Sample Size Calculations 182
10.1.4 Data Collection Methods 183
10.1.5 Clusters 183
10.1.6 Validation Methods 184
10.2 Text, Table, or Graph? 185
10.3 Summarizing Your Results 186
10.3.1 Center of the Distribution 189
10.3.2 Dispersion 189
10.3.3 Categorical Data 190
10.4 Reporting Analysis Results 191
10.4.1 p-Values? Or Confidence Intervals? 192
10.5 Exceptions Are the Real Story 193
10.5.1 Nonresponders 193
10.5.2 The Missing Holes 194
10.5.3 Missing Data 194
10.5.4 Recognize and Report Biases 194
10.6 Summary and Review 195
11. Problem Solving 197
11.1 The Problems 197
11.2 Solving Practical Problems 201
11.2.1 Provenance of the Data 201
11.2.2 Inspect the Data 202
11.2.3 Validate the Data Collection Methods 202
11.2.4 Formulate Hypotheses 203
11.2.5 Choosing a Statistical Methodology 203
11.2.6 Be Aware of What You Don't Know 204
11.2.7 Qualify Your Conclusions 204
Answers to Selected Exercises 205
Index 207
