Introductory Statistics (eBook, ePUB)
Versandkostenfrei!
Sofort per Download lieferbar
67,95 €
inkl. MwSt.
Weitere Ausgaben:

PAYBACK Punkte
34 °P sammeln!
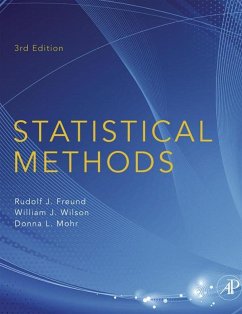
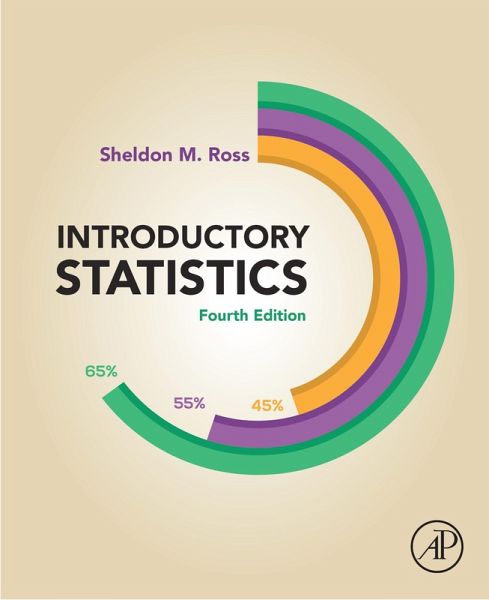
Introductory Statistics, Fourth Edition, reviews statistical concepts and techniques in a manner that will teach students not only how and when to utilize the statistical procedures developed, but also how to understand why these procedures should be used. The text's main merits are the clarity of presentation, contemporary examples and applications from diverse areas, an explanation of intuition, and the ideas behind the statistical methods. Concepts are motivated, illustrated, and explained in a way that attempts to increase one's intuition. To quote from the preface, it is only when a stude...
Introductory Statistics, Fourth Edition, reviews statistical concepts and techniques in a manner that will teach students not only how and when to utilize the statistical procedures developed, but also how to understand why these procedures should be used. The text's main merits are the clarity of presentation, contemporary examples and applications from diverse areas, an explanation of intuition, and the ideas behind the statistical methods. Concepts are motivated, illustrated, and explained in a way that attempts to increase one's intuition. To quote from the preface, it is only when a student develops a feel or intuition for statistics that she or he is really on the path toward making sense of data. Ross achieves this goal through a coherent mix of mathematical analysis, intuitive discussions, and examples. Applications and examples refer to real-world issues, such as gun control, stock price models, health issues, driving age limits, school admission ages, use of helmets, sports, scientific fraud, and many others. Examples relating to data mining techniques using the number of Google queries or Twitter tweets are also considered. For this fourth edition, new topical coverage includes sections on Pareto distribution and the 80-20 rule, Benford's law, added material on odds and joint distributions and correlation, logistic regression, A-B testing, and more modern (big data) examples and exercises. - Includes new section on Pareto distribution and the 80-20 rule, Benford's law, odds, joint distribution and correlation, logistic regression, A-B testing, and examples from the world of analytics and big data - Comprehensive edition that includes the most commonly used statistical software packages (SAS, SPSS, Minitab) - Presents a unique, historical perspective, profiling prominent statisticians and historical events to motivate learning by including interest and context - Provides exercises and examples that help guide the student towards indpendent learning using real issues and real data, e.g. stock price models, health issues, gender issues, sports, and scientific fraud
Dieser Download kann aus rechtlichen Gründen nur mit Rechnungsadresse in A, B, BG, CY, CZ, D, DK, EW, E, FIN, F, GR, HR, H, IRL, I, LT, L, LR, M, NL, PL, P, R, S, SLO, SK ausgeliefert werden.


