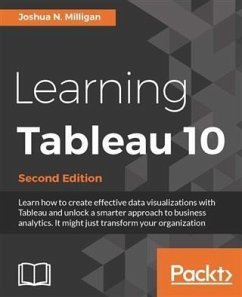
About This Book
- Create stylish visualizations and dashboards that explain complexity with clarity
- Learn effective data storytelling to transform how your business uses ideas and makes decisions
- Explore all the new features in Tableau 10 and start to redefine what business analytics means to your organization
Got data? Not sure what to make of it? This is the guide for you - whether you've been working with Tableau for years or are just beginning your adventure into business analytics.
What You Will Learn
- Find out how to build effective visualizations and dashboards
- Prepare and clean your data so you can be sure Tableau is finding answers to your questions - not raising more problems
- Discover how to create advanced visualizations that explain complexity with clarity and style
- Dig deeper into your data with clustering and distribution models that allow you to analyze trends and make forecasts
- Learn how to use data storytelling to aid decision-making and strategy
- Share dashboards and visualizations to cultivate a culture where data is available and valued
Tableau has for some time been one of the most popular Business Intelligence and data visualization tools available. Why? Because, quite simply, it's a tool that's responsive to the needs of modern businesses. But it's most effective when you know how to get what you want from it - it might make your business intelligent, but it isn't going to make you intelligent...
We'll make sure you're well prepared to take full advantage of Tableau 10's new features. Whether you're an experienced data analyst that wants to explore 2016's new Tableau, or you're a beginner that wants to expand their skillset and bring a more professional and sharper approach to their organization, we've got you covered. Beginning with the fundamentals, such as data preparation, you'll soon learn how to build and customize your own data visualizations and dashboards, essential for high-level visibility and effective data storytelling. You'll also find out how to so trend analysis and forecasting using clustering and distribution models to inform your analytics.
But it's not just about you - when it comes to data it's all about availability and access. That's why we'll show you how to share your Tableau visualizations. It's only once insights are shared and communicated that you - and your organization - will start making smarter and informed decisions. And really, that's exactly what this guide is for.
Style and approach
Practical yet comprehensive, this Tableau guide takes you from the fundamentals of the tool before diving deeper into creating advanced visualizations. Covering the latest features found in Tableau 10, this might be the guide that transforms your organization.
Dieser Download kann aus rechtlichen Gründen nur mit Rechnungsadresse in A, B, BG, CY, CZ, D, DK, EW, E, FIN, F, GR, HR, H, IRL, I, LT, L, LR, M, NL, PL, P, R, S, SLO, SK ausgeliefert werden.

