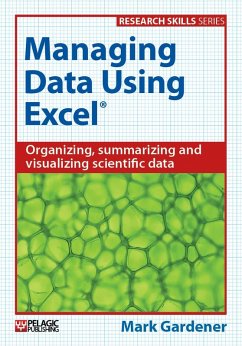
Microsoft Excel is a powerful tool that can transform the way you use data. This book explains in comprehensive and user-friendly detail how to manage, make sense of, explore and share data, giving scientists at all levels the skills they need to maximize the usefulness of their data.
Readers will learn how to use Excel to:
* Build a dataset - how to handle variables and notes, rearrangements and edits to data.
* Check datasets - dealing with typographic errors, data validation and numerical
errors.
* Make sense of data - including datasets for regression and correlation; summarizing data with averages and variability; and visualizing data with graphs, pivot charts and sparklines.
* Explore regression data - finding, highlighting and visualizing correlations.
* Explore time-related data - using pivot tables, sparklines and line plots.
* Explore association data - creating and visualizing contingency tables.
* Explore differences - pivot tables and data visualizations including box-whisker plots.
* Share data - methods for exporting and sharing your datasets, summaries and
graphs.
Alongside the text, Have a Go exercises, Tips and Notes give readers practical experience and highlight important points, and helpful self-assessment exercises and summary tables can be found at the end of each chapter. Supplementary material can also be downloaded on the companion website.
Managing Data Using Excel is an essential book for all scientists and students who use data and are seeking to manage data more effectively. It is aimed at scientists at all levels but it is especially useful for university-level research, from undergraduates to postdoctoral researchers.
Dieser Download kann aus rechtlichen Gründen nur mit Rechnungsadresse in A, D ausgeliefert werden.

