
Alle Infos zum eBook verschenken

- Format: PDF
- Merkliste
- Auf die Merkliste
- Bewerten Bewerten
- Teilen
- Produkt teilen
- Produkterinnerung
- Produkterinnerung

Hier können Sie sich einloggen

Bitte loggen Sie sich zunächst in Ihr Kundenkonto ein oder registrieren Sie sich bei bücher.de, um das eBook-Abo tolino select nutzen zu können.
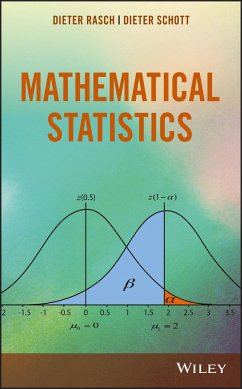
Explores mathematical statistics in its entirety--from the fundamentals to modern methods This book introduces readers to point estimation, confidence intervals, and statistical tests. Based on the general theory of linear models, it provides an in-depth overview of the following: analysis of variance (ANOVA) for models with fixed, random, and mixed effects; regression analysis is also first presented for linear models with fixed, random, and mixed effects before being expanded to nonlinear models; statistical multi-decision problems like statistical selection procedures (Bechhofer and Gupta)…mehr
- Geräte: PC
- mit Kopierschutz
- eBook Hilfe
- Größe: 16.59MB
![Theory and Statistical Applications of Stochastic Processes (eBook, PDF) Theory and Statistical Applications of Stochastic Processes (eBook, PDF)]() Yuliya MishuraTheory and Statistical Applications of Stochastic Processes (eBook, PDF)139,99 €
Yuliya MishuraTheory and Statistical Applications of Stochastic Processes (eBook, PDF)139,99 €![Robust Estimation and Testing (eBook, PDF) Robust Estimation and Testing (eBook, PDF)]() Robert G. StaudteRobust Estimation and Testing (eBook, PDF)246,99 €
Robert G. StaudteRobust Estimation and Testing (eBook, PDF)246,99 €![Level Sets and Extrema of Random Processes and Fields (eBook, PDF) Level Sets and Extrema of Random Processes and Fields (eBook, PDF)]() Jean-Marc AzaisLevel Sets and Extrema of Random Processes and Fields (eBook, PDF)131,99 €
Jean-Marc AzaisLevel Sets and Extrema of Random Processes and Fields (eBook, PDF)131,99 €![Geometrical Foundations of Asymptotic Inference (eBook, PDF) Geometrical Foundations of Asymptotic Inference (eBook, PDF)]() Robert E. KassGeometrical Foundations of Asymptotic Inference (eBook, PDF)195,99 €
Robert E. KassGeometrical Foundations of Asymptotic Inference (eBook, PDF)195,99 €![Markov Processes (eBook, PDF) Markov Processes (eBook, PDF)]() Stewart N. EthierMarkov Processes (eBook, PDF)127,99 €
Stewart N. EthierMarkov Processes (eBook, PDF)127,99 €![Aspects of Statistical Inference (eBook, PDF) Aspects of Statistical Inference (eBook, PDF)]() A. H. WelshAspects of Statistical Inference (eBook, PDF)185,99 €
A. H. WelshAspects of Statistical Inference (eBook, PDF)185,99 €![Sequential Estimation (eBook, PDF) Sequential Estimation (eBook, PDF)]() Malay GhoshSequential Estimation (eBook, PDF)196,99 €
Malay GhoshSequential Estimation (eBook, PDF)196,99 €-
-
-
Dieser Download kann aus rechtlichen Gründen nur mit Rechnungsadresse in A, B, BG, CY, CZ, D, DK, EW, E, FIN, F, GR, HR, H, IRL, I, LT, L, LR, M, NL, PL, P, R, S, SLO, SK ausgeliefert werden.
- Produktdetails
- Verlag: John Wiley & Sons
- Seitenzahl: 688
- Erscheinungstermin: 10. Januar 2018
- Englisch
- ISBN-13: 9781119385264
- Artikelnr.: 52560169
- Verlag: John Wiley & Sons
- Seitenzahl: 688
- Erscheinungstermin: 10. Januar 2018
- Englisch
- ISBN-13: 9781119385264
- Artikelnr.: 52560169
- Herstellerkennzeichnung Die Herstellerinformationen sind derzeit nicht verfügbar.
B
A) 279 5.4.3 Mixed Classification 282 5.4.3.1 Cross-Classification between Two Factors Where One of Them Is Subordinated to a Third Factor B
A × C 282 5.4.3.2 Cross-Classification of Two Factors in Which a Third Factor Is Nested C
A× B 288 5.5 Exercises 291 References 291 6 Analysis of Variance: Estimation of Variance Components (Model II of the Analysis of Variance) 293 6.1 Introduction: Linear Models with Random Effects 293 6.2 One-Way Classification 297 6.2.1 Estimation of Variance Components 300 6.2.1.1 Analysis of Variance Method 300 6.2.1.2 Estimators in Case of Normally Distributed Y 302 6.2.1.3 REML: Estimation 304 6.2.1.4 Matrix Norm Minimising Quadratic Estimation 305 6.2.1.5 Comparison of Several Estimators 306 6.2.2 Tests of Hypotheses and Confidence Intervals 308 6.2.3 Variances and Properties of the Estimators of the Variance Components 310 6.3 Estimators of Variance Components in the Two-Way and Three-Way Classification 315 6.3.1 General Description for Equal and Unequal Subclass Numbers 315 6.3.2 Two-Way Cross-Classification 319 6.3.3 Two-Way Nested Classification 324 6.3.4 Three-Way Cross-Classification with Equal Subclass Numbers 326 6.3.5 Three-Way Nested Classification 334 6.3.6 Three-Way Mixed Classification 334 6.4 Planning Experiments 336 6.5 Exercises 338 References 339 7 Analysis of Variance: Models with Finite Level Populations and Mixed Models 341 7.1 Introduction: Models with Finite Level Populations 341 7.2 Rules for the Derivation of SS, df, MS and E(MS) in Balanced ANOVA Models 343 7.3 Variance Component Estimators in Mixed Models 348 7.3.1 An Example for the Balanced Case 349 7.3.2 The Unbalanced Case 351 7.4 Tests for Fixed Effects and Variance Components 353 7.5 Variance Component Estimation and Tests of Hypotheses in Special Mixed Models 354 7.5.1 Two-Way Cross-Classification 355 7.5.2 Two-Way Nested Classification B
A 358 7.5.2.1 Levels of A Random 360 7.5.2.2 Levels of B Random 361 7.5.3 Three-Way Cross-Classification 362 7.5.4 Three-Way Nested Classification 365 7.5.5 Three-Way Mixed Classification 369 7.5.5.1 The Type (B
A) × C 369 7.5.5.2 The Type C
AB 374 7.6 Exercises 376 References 376 8 Regression Analysis: Linear Models with Non-random Regressors (Model I of Regression Analysis) and with Random Regressors (Model II of Regression Analysis) 377 8.1 Introduction 377 8.2 Parameter Estimation 380 8.2.1 Least Squares Method 380 8.2.2 Optimal Experimental Design 394 8.3 Testing Hypotheses 397 8.4 Confidence Regions 406 8.5 Models with Random Regressors 410 8.5.1 Analysis 410 8.5.2 Experimental Designs 415 8.6 Mixed Models 416 8.7 Concluding Remarks about Models of Regression Analysis 417 8.8 Exercises 419 References 419 9 Regression Analysis: Intrinsically Non-linear Model I 421 9.1 Estimating by the Least Squares Method 424 9.1.1 Gauß-Newton Method 425 9.1.2 Internal Regression 431 9.1.3 Determining Initial Values for Iteration Methods 433 9.2 Geometrical Properties 434 9.2.1 Expectation Surface and Tangent Plane 434 9.2.2 Curvature Measures 440 9.3 Asymptotic Properties and the Bias of LS Estimators 443 9.4 Confidence Estimations and Tests 447 9.4.1 Introduction 447 9.4.2 Tests and Confidence Estimations Based on the Asymptotic Covariance Matrix 451 9.4.3 Simulation Experiments to Check Asymptotic Tests and Confidence Estimations 452 9.5 Optimal Experimental Design 454 9.6 Special Regression Functions 458 9.6.1 Exponential Regression 458 9.6.1.1 Point Estimator 458 9.6.1.2 Confidence Estimations and Tests 460 9.6.1.3 Results of Simulation Experiments 463 9.6.1.4 Experimental Designs 466 9.6.2 The Bertalanffy Function 468 9.6.3 The Logistic (Three-Parametric Hyperbolic Tangent) Function 473 9.6.4 The Gompertz Function 476 9.6.5 The Hyperbolic Tangent Function with Four Parameters 479 9.6.6 The arc tangent Function with Four Parameters 484 9.6.7 The Richards Function 487 9.6.8 Summarising the Results of Sections 9.6.1-9.6.7 487 9.6.9 Problems of Model Choice 488 9.7 Exercises 489 References 490 10 Analysis of Covariance (ANCOVA) 495 10.1 Introduction 495 10.2 General Model I-I of the Analysis of Covariance 496 10.3 Special Models of the Analysis of Covariance for the Simple Classification 503 10.3.1 One Covariable with Constant
504 10.3.2 A Covariable with Regression Coefficients
i Depending on the Levels of the Classification Factor 506 10.3.3 A Numerical Example 507 10.4 Exercises 510 References 511 11 Multiple Decision Problems 513 11.1 Selection Procedures 514 11.1.1 Basic Ideas 514 11.1.2 Indifference Zone Formulation for Expectations 516 11.1.2.1 Selection of Populations with Normal Distribution 517 11.1.2.2 Approximate Solutions for Non-normal Distributions and t = 1 529 11.1.3 Selection of a Subset Containing the Best Population with Given Probability 530 11.1.3.1 Selection of the Normal Distribution with the Largest Expectation 534 11.1.3.2 Selection of the Normal Distribution with Smallest Variance 535 11.2 Multiple Comparisons 536 11.2.1 Confidence Intervals for All Contrasts: Scheffé's Method 542 11.2.2 Confidence Intervals for Given Contrast: Bonferroni's and Dunn's Method 547 11.2.3 Confidence Intervals for All Contrasts for ni = n: Tukey's Method 550 11.2.4 Confidence Intervals for All Contrast: Generalised Tukey's Method 553 11.2.5 Confidence Intervals for the Differences of Treatments with a Control: Dunnett's Method 555 11.2.6 Multiple Comparisons and Confidence Intervals 556 11.2.7 Which Multiple Comparisons Shall Be Used? 559 11.3 A Numerical Example 560 11.4 Exercises 564 References 564 12 Experimental Designs 567 12.1 Introduction 568 12.2 Block Designs 571 12.2.1 Completely Balanced Incomplete Block Designs (BIBD) 574 12.2.2 Construction Methods of BIBD 582 12.2.3 Partially Balanced Incomplete Block Designs 596 12.3 Row-Column Designs 600 12.4 Factorial Designs 603 12.5 Programs for Construction of Experimental Designs 604 12.6 Exercises 604 References 605 Appendix A: Symbolism 609 Appendix B: Abbreviations 611 Appendix C: Probability and Density Functions 613 Appendix D: Tables 615 Solutions and Hints for Exercises 627 Index 659
