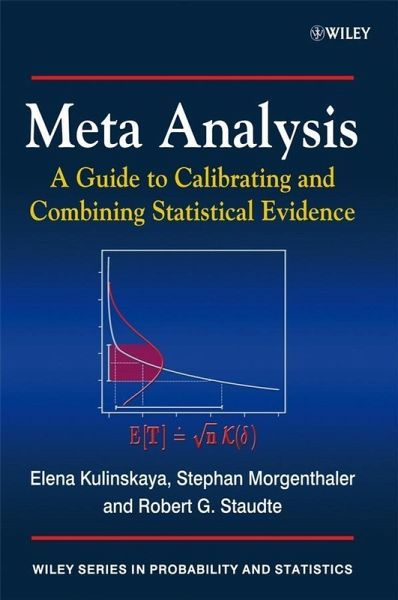
Meta Analysis (eBook, PDF)
A Guide to Calibrating and Combining Statistical Evidence
Alle Infos zum eBook verschenken
Meta Analysis (eBook, PDF)
A Guide to Calibrating and Combining Statistical Evidence
- Format: PDF
- Merkliste
- Auf die Merkliste
- Bewerten Bewerten
- Teilen
- Produkt teilen
- Produkterinnerung
- Produkterinnerung
Hier können Sie sich einloggen
Bitte loggen Sie sich zunächst in Ihr Kundenkonto ein oder registrieren Sie sich bei bücher.de, um das eBook-Abo tolino select nutzen zu können.
Meta Analysis: A Guide to Calibrating and Combining Statistical Evidence acts as a source of basic methods for scientists wanting to combine evidence from different experiments. The authors aim to promote a deeper understanding of the notion of statistical evidence. The book is comprised of two parts - The Handbook, and The Theory. The Handbook is a guide for combining and interpreting experimental evidence to solve standard statistical problems. This section allows someone with a rudimentary knowledge in general statistics to apply the methods. The Theory provides the motivation, theory and…mehr
- Geräte: PC
- mit Kopierschutz
- eBook Hilfe
- Größe: 2.67MB
Dieser Download kann aus rechtlichen Gründen nur mit Rechnungsadresse in D ausgeliefert werden.
- Produktdetails
- Verlag: Wiley
- Erscheinungstermin: 2. August 2008
- Englisch
- ISBN-13: 9780470985526
- Artikelnr.: 37301405
- Verlag: Wiley
- Erscheinungstermin: 2. August 2008
- Englisch
- ISBN-13: 9780470985526
- Artikelnr.: 37301405
- Herstellerkennzeichnung Die Herstellerinformationen sind derzeit nicht verfügbar.
1.1 A calibration scale for evidence
1.2 Glass ionomer versus resin sealants
1.3 Measures of effect size for two studies
1.4 Summary
I. THE METHODS 23
2. Measurements with known precision
2.1 Evidence for one-sided alternatives
2.2 Evidence for two-sided alternatives
2.3 Examples
3. Measurements with unknown precision
3.1 Effects and standardized effects
3.2 Paired comparisons
3.3 Examples
4. Comparing treatment to control
4.1 Equal unknown precision
4.2 Differing unknown precision
4.3 Examples
5. Comparing K treatments 59
5.1 Methodology
5.2 Examples
6. Evaluating risks
6.1 Methodology
6.2 Examples
7. Comparing risks
7.1 Methodology
7.2 Examples
8. Evaluating Poisson rates
8.1 Methodology
8.2 Example
9. Comparing Poisson rates
9.1 Methodology
9.2 Example
10. Goodness-of-fit testing
10.1 Methodology
10.2 Examples
11. Evidence for heterogeneity
11.1 Methodology
11.2 Examples
12. Combining evidence: fixed effects
12.1 Methodology
12.2 Examples
13. Combining evidence: random effects
13.1 Methodology
13.2 Examples
14. Meta-regression
14.1 Methodology
14.2 Commonly encountered situations
14.3 Examples
15. Accounting for publication bias
15.1 The downside of publishing
15.2 Examples
II. THE THEORY
16. Calibrating evidence in a test
16.1 Evidence for one-sided alternatives
16.2 Random p-value behavior
16.3 Publication bias
16.4 Comparison with a Bayesian calibration
16.5 Summary
17. Variance stabilizing transformations
17.1 Standardizing the sample mean
17.2 Variance stabilizing transformations
17.3 Poisson model example
17.4 2-sided evidence from 1-sided evidence
17.5 Summary
18. One-sample Binomial tests
18.1 Variance stabilizing the risk estimator
18.2 Confidence intervals for p
18.3 Relative risk and odds ratio
18.4 Confidence intervals for small risks p
18.5 Summary
19. Two-sample binomial tests
19.1 Evidence for a positive effect
19.2 Confidence intervals for effect sizes
19.3 Estimating the risk difference
19.4 Relative risk and odds ratio
19.5 Recurrent urinary tract infections
19.6 Summary
20. Defining evidence in t-statistics
20.1 Example
20.2 Evidence in the Student t-statistic
20.3 The key inferential function for Student's model
20.4 Corrected evidence
20.5 A confidence interval for the standardized effect
20.6 Comparing evidence in t and z tests
21. Two-sample Comparisons
21.1 Drop in systolic blood pressure
21.2 Defining the standardized effect
21.3 Evidence in the Welch statistic
21.4 Confidence intervals for ±
21.5 Summary
22. Evidence in the Â2-statistic
22.1 The non-central Â2 distribution
22.2 A vst for the non-central Â2 statistic
22.3 Simulation studies
22.4 Choosing the sample size
22.5 Evidence for > 0
22.6 Summary
22.7 Summary
23. Evidence in F-tests
23.1 vst for the noncentral F
23.2 The Evidence Distribution
23.3 The Key inferential function
23.4 The Random Effects Model
23.5 Summary
24. Evidence in Cochran's Q
24.1 Cochran's Q: the fixed effects model
24.2 Simulation studies
24.3 Cochran's Q: the random effects model
24.4 Summary
25. Combining evidence
25.1 Background and preliminary steps
25.2 Fixed standardized effects
25.3 Random transformed effects
25.4 Example: drop in systolic blood pressure
25.5 Summary
26. Publication Bias
26.1 Publication Bias
26.2 The Truncated Normal Distribution
26.3 Bias Correction Based on Censoring
26.4 Summary
27. Asymptotics
27.1 Existence of the variance stabilizing transformation
27.2 Tests and Effect sizes
27.3 Power and efficiency
27.4 Summary