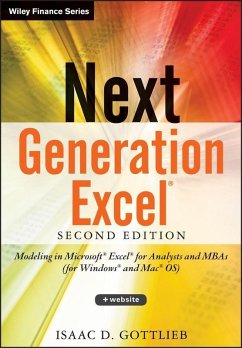
Next Generation Excel (eBook, PDF)
Modeling In Excel For Analysts And MBAs (For MS Windows And Mac OS)
Alle Infos zum eBook verschenken
Next Generation Excel (eBook, PDF)
Modeling In Excel For Analysts And MBAs (For MS Windows And Mac OS)
- Format: PDF
- Merkliste
- Auf die Merkliste
- Bewerten Bewerten
- Teilen
- Produkt teilen
- Produkterinnerung
- Produkterinnerung
Hier können Sie sich einloggen
Bitte loggen Sie sich zunächst in Ihr Kundenkonto ein oder registrieren Sie sich bei bücher.de, um das eBook-Abo tolino select nutzen zu können.
Take Excel to the next level in accounting and financial modeling In this new Second Edition of Next Generation Excel, Isaac Gottlieb shows financial analysts how to harness the full power of Excel to move forward into the new world of accounting and finance. Companies of all sizes use financial models to analyze their finances and plan business operations, as well as to create financial accounting reports like balance sheets, income statements, and statements of cash flows. While many businesspeople are quite familiar with the reports created with financial models, most are not as familiar…mehr
- Geräte: PC
- mit Kopierschutz
- eBook Hilfe
- Größe: 126.27MB
- Humphrey K. K. TungProfessional Financial Computing Using Excel and VBA (eBook, PDF)90,99 €
- Isaac GottliebNext Generation Excel (eBook, ePUB)80,99 €
- Mary JacksonAdvanced Modelling in Finance using Excel and VBA (eBook, PDF)81,99 €
- Fabrice D. RouahOption Pricing Models and Volatility Using Excel-VBA (eBook, PDF)73,99 €
- Sarah NewcombLoaded (eBook, PDF)17,99 €
- Steve MooreIneffective Habits of Financial Advisors (and the Disciplines to Break Them) (eBook, PDF)23,99 €
- Irene AldridgeBig Data Science in Finance (eBook, PDF)80,99 €
-
-
-
Dieser Download kann aus rechtlichen Gründen nur mit Rechnungsadresse in A, B, BG, CY, CZ, D, DK, EW, E, FIN, F, GR, HR, H, IRL, I, LT, L, LR, M, NL, PL, P, R, S, SLO, SK ausgeliefert werden.
- Produktdetails
- Verlag: Jossey-Bass
- Seitenzahl: 416
- Erscheinungstermin: 4. Februar 2013
- Englisch
- ISBN-13: 9781118469095
- Artikelnr.: 38243869
- Verlag: Jossey-Bass
- Seitenzahl: 416
- Erscheinungstermin: 4. Februar 2013
- Englisch
- ISBN-13: 9781118469095
- Artikelnr.: 38243869
- Herstellerkennzeichnung Die Herstellerinformationen sind derzeit nicht verfügbar.
Preface xvii
Acknowledgments xxi
PART ONE Using Excel Efficiently 1
CHAPTER 1 AutoFill 3
AutoFill Options 8
Right-Drag AutoFill 8
Appendix: AutoFill in Excel 2003 and Excel Mac 2011 10
Review Questions 13
Answers 14
CHAPTER 2 Selecting Efficiently in Excel 15
Review Questions 18
Answers 19
CHAPTER 3 Formulas, Functions, and Relative and Absolute Addressing 21
Relative and Absolute Addressing 22
Other Functions 25
Appendix: Doing It in Mac Excel 2011 28
Review Questions 29
Answers 30
CHAPTER 4 Naming Cells and Ranges 31
Naming a Single Cell 31
Naming a Range of Cells 33
Using the Name Menu to Create Names 34
Appendix: Using the Names Menu in Excel 2003 and Mac Excel 2011 38
Review Questions 41
Answers 42
CHAPTER 5 Conditional and Advanced Conditional Formatting in Excel 45
Simple Conditional Formatting; Adding a Rule 45
New Conditional Formatting Features 46
Advanced Conditional Formatting 49
Appendix: Using the Conditional Formatting in Excel 2003 52
Review Questions 53
Answers 55
CHAPTER 6 Excel Charts 57
Quick/Instant Chart 57
Creating a Chart Using the Menu 57
Adding More Data to an Existing Chart 61
More about Charts 64
Three-Dimensional Charts-Column and Pie 66
Pie Charts 70
Appendix: Generating Charts in Excel 2003 and Mac Excel 2011 73
CHAPTER 7 Sparklines and Advanced Topics in Excel Charts 81
Sparklines 81
More about Charts 83
Review Questions 90
Answers 91
PART TWO IF Functions and Text Manipulations 93
CHAPTER 8 IF Functions 95
Simple IF Functions 95
Nested IF Functions 98
Nested IF-Payroll Example 99
Appendix: Using the IF Function in Mac Excel 2011 101
Review Questions 102
Answers 102
CHAPTER 9 Text Manipulation 103
Text to Columns 103
Appendix: Using Text to Column in Excel 2003 108
Review Questions 111
Answers 112
PART THREE Statistical Tools 113
CHAPTER 10 Descriptive Statistics 115
Descriptive Statistics 115
Appendix: Descriptive Statistics with the Mac Excel 2011 117
Review Questions 119
Answers 119
CHAPTER 11 Frequency Distributions 121
One More Example 126
Appendix: Frequency Distributions with Mac Excel 2011 129
Review Questions 129
Answers 130
CHAPTER 12 Statistical Regression 131
Using the Scatter Chart in Excel 131
Linear Regression-Using Excel Functions 133
Appendix: Using the Chart Feature to Create a
Trend Line in Excel 2003 and Mac Excel 2011 137
Review Questions 140
Answers 140
CHAPTER 13 Data Analysis-The Excel Easy to Use Statistics Add-In 141
Descriptive Statistics 141
Frequency Distribution Using Histogram 143
Appendix: Using Data Analysis in Excel Mac 2011 and Excel 2003 148
Review Questions 148
Answers 149
CHAPTER 14 Data Analysis-Multi-Regression 151
Simple or Single Variable Regression 151
Multi-Regression 152
Appendix: Using Data Analysis in Excel Mac 2011 and Excel 2003 160
Review Questions 160
Answers 161
PART FOUR What-If Analysis 165
CHAPTER 15 Naming Cells-For Meaningful Decision Making and Modeling 167
One More Example-If You Have a Ready Model 168
Appendix: Create and Apply Names in Excel 2003 and Mac Excel 2011 170
Review Questions 175
Answers 175
CHAPTER 16 What-If Analysis and Goal Seek 177
Goal Seek 178
Appendix: Goal Seek in Excel 2003 and Mac Excel 2011 182
Review Questions 183
Answers 183
CHAPTER 17 Sensitivity Analysis-One- and Two-Way Data Tables 185
Two-Way Table 187
Data Tables-One More Example 189
Break-Even Point (BEP) Chart 190
Appendix: Sensitivity Analysis-One- and Two-Way Data Tables for Excel 2003
and Mac Excel 2011 192
Review Questions 193
Answers 195
CHAPTER 18 Using Scroll Bars for Sensitivity Analysis 199
Scroll Bar Limitations 203
Appendix: Adding a Scroll Bar in Excel 2003, 2007, and Mac Excel 2011 205
Review Questions 207
Answers 208
PART FIVE Multi-Page Systems and Lookups 211
CHAPTER 19 Multi-Page Budgets-Going to the Third Dimension 213
A Payroll Example 213
A Second Example-Bakers' Supplies 217
Review Questions 219
Answers 220
CHAPTER 20 Lookup Tables 221
Range-Approximate Match Lookup 221
An Exact Match Lookup 224
Review Questions 227
Answers 228
PART SIX The Data Menu and Ribbon 229
CHAPTER 21 Sorting Data 231
Sorting by Multiple Parameters 233
Appendix: Sorting in Excel 2003 and Mac Excel 2011 236
Review Questions 238
Answers 239
CHAPTER 22 AutoFilter 241
Dates 241
Below and Above Average 243
Filter by Color 243
Appendix: AutoFilter in Excel 2003 244
Review Questions 246
Answers 247
CHAPTER 23 Data Forms and Features Eliminated in Excel 2007 and 2010 249
Appendix: The Data Form in Excel 2003 or Earlier versions and Mac Excel
2011 251
Review Questions 252
Answers 253
CHAPTER 24 Group and Outline Data 255
Appendix: Group and Outline Data Excel 2003 and Mac Excel 2011 258
Review Questions 260
Answers 261
CHAPTER 25 Excel Subtotals 263
One More Example-Function Applied to Multiple Categories 265
Copying Grouped Data 265
Second Example-Larger Database 269
Appendix: Creating Subtotals in Excel 2003 and Mac Excel 2011 269
Review Questions 273
Answers 273
CHAPTER 26 Pivot Tables 275
PivotTable Example 275
Appendix: The Pivot Table in Excel 2003 and Mac Excel 2011 282
Review Questions 286
Answers 286
CHAPTER 27 Data Mining Using Pivot Tables 289
Appendix: Advanced PivotTable Techniques in Excel 2003 296
Review Questions 297
Answers 298
CHAPTER 28 Using Slicers to Filter Pivot Tables 301
Format a Slicer 302
Sharing Slicers for More Than One Pivot Table 304
Review Questions 305
Answers 306
PART SEVEN Excel Financial Tools 307
CHAPTER 29 NPV and IRR-Evaluating Capital Investments 309
The Time Value of Money 309
IRR-Internal Rate of Return 311
Review Questions 313
Answers 313
CHAPTER 30 Unconventional Financial Functions: XNPV and XIRR 315
Excel XNPV-The Net Present Value Function for Uneven Intervals 315
Excel XIRR-The Internal Rate of Return Function for Uneven Intervals 316
Review Questions 318
Answers 318
CHAPTER 31 Frequently Used Financial Functions 319
Similar Excel Functions 320
Review Questions 323
Answers 323
CHAPTER 32 Amortization Tables 325
Amortization Example 325
Review Questions 334
Answers 334
CHAPTER 33 Accounting Depreciation Functions 337
SLD Straight Line Depreciation 337
SYD Sum of the Years Digits 337
Review Questions 339
Answers 339
PART EIGHT Using the Solver Add-In 341
CHAPTER 34 Beyond the Goal Seek-More Than One Changing Cell? Use the Solver
343
Example-Break-Even Point 343
Using the Solver 343
Appendix: Using the Solver in Excel 2003 and Mac Excel 2011 349
Review Questions 350
Answers 352
CHAPTER 35 The Solver Add-In-Optimizer 353
Solver Example 353
Nonlinear Example Using the Solver 355
Appendix: Using the Solver in Excel 2003 and Mac 2011 360
Review Questions 360
Answers 360
Appendix Summary Case Study-Supply Chain Management Example 365
About the Author 385
Index 387