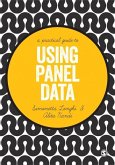
Using diverse real-world examples, this text examines what models used for data analysis mean in a specific research context. What assumptions underlie analyses, and how can you check them? Building on the successful 'Data Analysis and Graphics Using R,' 3rd edition (Cambridge, 2010), it expands upon topics including cluster analysis, exponential time series, matching, seasonality, and resampling approaches. An extended look at p-values leads to an exploration of replicability issues and of contexts where numerous p-values exist, including gene expression. Developing practical intuition, this book assists scientists in the analysis of their own data, and familiarizes students in statistical theory with practical data analysis. The worked examples and accompanying commentary teach readers to recognize when a method works and, more importantly, when it doesn't. Each chapter contains copious exercises. Selected solutions, notes, slides, and R code are available online, with extensive references pointing to detailed guides to R.
Dieser Download kann aus rechtlichen Gründen nur mit Rechnungsadresse in A, B, BG, CY, CZ, D, DK, EW, E, FIN, F, GR, HR, H, IRL, I, LT, L, LR, M, NL, PL, P, R, S, SLO, SK ausgeliefert werden.


