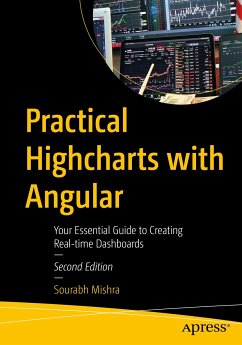
Learn to create stunning animated and interactive charts using Highcharts and Angular. This updated edition will build on your existing knowledge of HTML, CSS, and JavaScript to develop impressive dashboards that will work in all modern browsers.
You will learn how to use Highcharts, call backend services for data, and easily construct real-time data dashboards so you can club your code with jQuery and Angular. This book provides the best solutions for real-time challenges and covers a wide range of charts including line, area, maps, plot, and much more. You will also learn about arc diagrams, bubble series, dependency wheels, and error bar series. After reading this book, you'll be able to export your charts in different formats for project-based learning.
Highcharts is one the most useful products worldwide for developing charting on the web, and Angular is well known for speed. Using Highcharts with Angular developers can build fast, interactive dashboards. Getup to speed using this book today.
You will:
- Create interactive animated styling themes and colors for a dashboard
- Work on a real-time data project using Web API and Ajax calls through different data sources
- Export charts in various formats
Dieser Download kann aus rechtlichen Gründen nur mit Rechnungsadresse in A, B, BG, CY, CZ, D, DK, EW, E, FIN, F, GR, HR, H, IRL, I, LT, L, LR, M, NL, PL, P, R, S, SLO, SK ausgeliefert werden.

