40,95 €
40,95 €
inkl. MwSt.
Sofort per Download lieferbar
20 °P sammeln
40,95 €
Als Download kaufen
40,95 €
inkl. MwSt.
Sofort per Download lieferbar
20 °P sammeln
Jetzt verschenken
Alle Infos zum eBook verschenken
40,95 €
inkl. MwSt.
Sofort per Download lieferbar
Alle Infos zum eBook verschenken
20 °P sammeln
- Format: ePub
- Merkliste
- Auf die Merkliste
- Bewerten Bewerten
- Teilen
- Produkt teilen
- Produkterinnerung
- Produkterinnerung
Bitte loggen Sie sich zunächst in Ihr Kundenkonto ein oder registrieren Sie sich bei
bücher.de, um das eBook-Abo tolino select nutzen zu können.
Hier können Sie sich einloggen
Sie sind bereits eingeloggt. Klicken Sie auf 2. tolino select Abo, um fortzufahren.
Bitte loggen Sie sich zunächst in Ihr Kundenkonto ein oder registrieren Sie sich bei bücher.de, um das eBook-Abo tolino select nutzen zu können.
Perfect for any statistics student or researcher, this book offers hands-on guidance on how to interpret and discuss your results in a way that not only gives them meaning, but also achieves maximum impact on your target audience. No matter what variables your data involves, it offers a roadmap for analysis and presentation that can be extended to other models and contexts.
Focused on best practices for building statistical models and effectively communicating their results, this book helps you:
- Find the right analytic and presentation techniques for your type of data
-…mehr
- Geräte: eReader
- mit Kopierschutz
- eBook Hilfe
- Größe: 23.09MB
Andere Kunden interessierten sich auch für
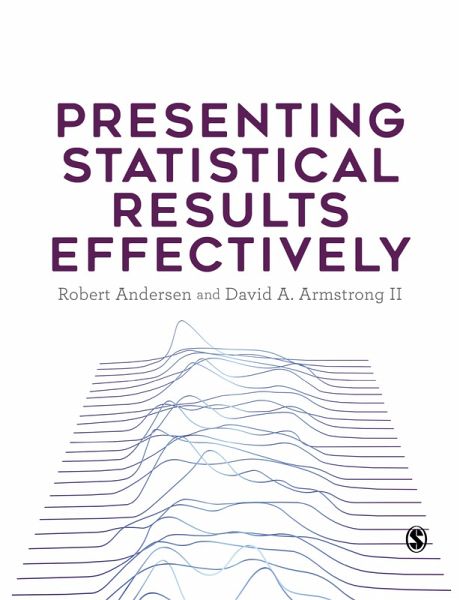
- Robert AndersenPresenting Statistical Results Effectively (eBook, ePUB)40,95 €
- Andy KirkData Visualisation (eBook, ePUB)49,95 €
- Adam FrostCommunicating with Data Visualisation (eBook, ePUB)44,95 €
- Andy KirkData Visualisation (eBook, ePUB)134,95 €
- Udo KuckartzQualitative Content Analysis (eBook, ePUB)45,95 €
-
-
-
Perfect for any statistics student or researcher, this book offers hands-on guidance on how to interpret and discuss your results in a way that not only gives them meaning, but also achieves maximum impact on your target audience. No matter what variables your data involves, it offers a roadmap for analysis and presentation that can be extended to other models and contexts.
Focused on best practices for building statistical models and effectively communicating their results, this book helps you:
- Find the right analytic and presentation techniques for your type of data
- Understand the cognitive processes involved in decoding information
- Assess distributions and relationships among variables
- Know when and how to choose tables or graphs
- Build, compare, and present results for linear and non-linear models
- Work with univariate, bivariate, and multivariate distributions
- Communicate the processes involved in and importance of your results.
Dieser Download kann aus rechtlichen Gründen nur mit Rechnungsadresse in A, D ausgeliefert werden.
Produktdetails
- Produktdetails
- Verlag: SAGE Publications
- Seitenzahl: 288
- Erscheinungstermin: 15. Dezember 2021
- Englisch
- ISBN-13: 9781473901148
- Artikelnr.: 60304948
- Verlag: SAGE Publications
- Seitenzahl: 288
- Erscheinungstermin: 15. Dezember 2021
- Englisch
- ISBN-13: 9781473901148
- Artikelnr.: 60304948
- Herstellerkennzeichnung Die Herstellerinformationen sind derzeit nicht verfügbar.
Robert Andersen is Professor of Business, Economics and Public Policy, and Professor of Strategy at the Ivey Business School, Western Univeristy. He is also cross-appointed in the Departments of Sociology, Political Science, and Statistics and Actuarial Science. His previous appointments include Distinguished Professor of Social Science at the University of Toronto, Senator William McMaster Chair in Political Sociology at McMaster University, and Senior Research Fellow at the University of Oxford.
Andersen's research expertise is in social statistics, social stratification, and political economy. Much of his recent research has explored the cross-national relationships between economic conditions, especially income inequality, and a wide array of attitudes and behaviours important for liberal democracy and a successful business environment, including social trust, tolerance, civic participation, support for democracy and attitudes toward public policy. His published research includes Modern Methods for Robust Regression (Sage, 2008), and more than 70 academic papers including articles in the Annual Review of Sociology, American Journal of Political Science, American Sociological Review, British Journal of Political Science, British Journal of Sociology, Journal of Politics, Journal of the Royal Statistical Society, and Sociological Methodology. Andersen has provided consulting for the United Nations, the European Commission, the Canadian Government and the Council of Ministers of Education, Canada.
Chapter 1: Some Foundation
What is a 'Model'?
Statistical Inference
Part A: General Principles of Effective Presentation
Chapter 2: Best Practices for Graphs and Tables
When to use Tables and Graphs
Constructing Effective Tables
Constructing Clear and Informative Graphs
Chapter 3: Methods for Visualizing Distributions
Displaying the Distributions of Categorical Variables
Displaying Distributions of Quantitative Variables
Transformations
Chapter 4: Exploring and Describing Relationships
Two Categorical Variables
Categorical Explanatory Variable and Quantitative Dependent Variable
Two quantitative Variables
Multivariate Displays
Part B: The Linear Model
Chapter 5: The Linear Regression Model
Ordinary Least Squares Regression
Hypothesis tests and confidence intervals
Assessing and Comparing Model Fit
Relative Importance of Predictors
Interpreting and presenting OLS models: Some empirical examples
Linear Probability Model
Chapter 6: Assessing the Impact and Importance of Multi-category
Explanatory Variables
Coding Multi-category Explanatory Variables
Revisiting Statistical Significance: Multi-category Predictors
Relative importance of sets of regressors
Graphical Presentation of Additive Effects
Chapter 7: Identifying and Handling Problems in Linear Models
Nonlinearity
Influential Observations
Heteroskedasticity
Nonnormality
Chapter 8: Modelling and Presentation of Curvilinear Effects
Curvilinearity in the Linear Model Framework
Nonlinear Transformations
Polynomial Regression
Regression Splines
Nonparametric Regression
Generalized Additive Models
Chapter 9: Interaction Effects in Linear Models
Understanding Interaction Effects
Interactions Between Two Categorical Variables
Interactions Between One Categorical Variable and One Quantitative Variable
Interactions Between Two Continuous Variables
Interaction Effects: Some Cautions and Recommendations
Part C: The Generalized Linear Model and Extensions
Chapter 10: Generalized Linear Models
Basics of the Generalized Linear Model
Maximum Likelihood Estimation
Hypothesis tests and confidence intervals
Assessing Model Fit
Empirical Example: Using Poisson Regression to Predict Counts
Understanding Effects of Variables
Measuring Variable Importance
Model Diagnostics
Chapter 11: Categorical Dependent Variables
Regression Models for Binary Outcomes
Interpreting Effects in Logit and Probit Models
Model Fit for Binary Regression Models
Diagnostics Specific to Binary Regression Models
Extending the Binary Regression Model - Ordered and Multinomial Models
Chapter 12: Conclusions and Recommendations
Choosing the Right Estimator
Research Design and Measurement Issues
Evaluating the Model
Effective Presentation of Results
Chapter 1: Some Foundation
What is a 'Model'?
Statistical Inference
Part A: General Principles of Effective Presentation
Chapter 2: Best Practices for Graphs and Tables
When to use Tables and Graphs
Constructing Effective Tables
Constructing Clear and Informative Graphs
Chapter 3: Methods for Visualizing Distributions
Displaying the Distributions of Categorical Variables
Displaying Distributions of Quantitative Variables
Transformations
Chapter 4: Exploring and Describing Relationships
Two Categorical Variables
Categorical Explanatory Variable and Quantitative Dependent Variable
Two quantitative Variables
Multivariate Displays
Part B: The Linear Model
Chapter 5: The Linear Regression Model
Ordinary Least Squares Regression
Hypothesis tests and confidence intervals
Assessing and Comparing Model Fit
Relative Importance of Predictors
Interpreting and presenting OLS models: Some empirical examples
Linear Probability Model
Chapter 6: Assessing the Impact and Importance of Multi-category Explanatory Variables
Coding Multi-category Explanatory Variables
Revisiting Statistical Significance: Multi-category Predictors
Relative importance of sets of regressors
Graphical Presentation of Additive Effects
Chapter 7: Identifying and Handling Problems in Linear Models
Nonlinearity
Influential Observations
Heteroskedasticity
Nonnormality
Chapter 8: Modelling and Presentation of Curvilinear Effects
Curvilinearity in the Linear Model Framework
Nonlinear Transformations
Polynomial Regression
Regression Splines
Nonparametric Regression
Generalized Additive Models
Chapter 9: Interaction Effects in Linear Models
Understanding Interaction Effects
Interactions Between Two Categorical Variables
Interactions Between One Categorical Variable and One Quantitative Variable
Interactions Between Two Continuous Variables
Interaction Effects: Some Cautions and Recommendations
Part C: The Generalized Linear Model and Extensions
Chapter 10: Generalized Linear Models
Basics of the Generalized Linear Model
Maximum Likelihood Estimation
Hypothesis tests and confidence intervals
Assessing Model Fit
Empirical Example: Using Poisson Regression to Predict Counts
Understanding Effects of Variables
Measuring Variable Importance
Model Diagnostics
Chapter 11: Categorical Dependent Variables
Regression Models for Binary Outcomes
Interpreting Effects in Logit and Probit Models
Model Fit for Binary Regression Models
Diagnostics Specific to Binary Regression Models
Extending the Binary Regression Model - Ordered and Multinomial Models
Chapter 12: Conclusions and Recommendations
Choosing the Right Estimator
Research Design and Measurement Issues
Evaluating the Model
Effective Presentation of Results
Chapter 1: Some Foundation
What is a 'Model'?
Statistical Inference
Part A: General Principles of Effective Presentation
Chapter 2: Best Practices for Graphs and Tables
When to use Tables and Graphs
Constructing Effective Tables
Constructing Clear and Informative Graphs
Chapter 3: Methods for Visualizing Distributions
Displaying the Distributions of Categorical Variables
Displaying Distributions of Quantitative Variables
Transformations
Chapter 4: Exploring and Describing Relationships
Two Categorical Variables
Categorical Explanatory Variable and Quantitative Dependent Variable
Two quantitative Variables
Multivariate Displays
Part B: The Linear Model
Chapter 5: The Linear Regression Model
Ordinary Least Squares Regression
Hypothesis tests and confidence intervals
Assessing and Comparing Model Fit
Relative Importance of Predictors
Interpreting and presenting OLS models: Some empirical examples
Linear Probability Model
Chapter 6: Assessing the Impact and Importance of Multi-category
Explanatory Variables
Coding Multi-category Explanatory Variables
Revisiting Statistical Significance: Multi-category Predictors
Relative importance of sets of regressors
Graphical Presentation of Additive Effects
Chapter 7: Identifying and Handling Problems in Linear Models
Nonlinearity
Influential Observations
Heteroskedasticity
Nonnormality
Chapter 8: Modelling and Presentation of Curvilinear Effects
Curvilinearity in the Linear Model Framework
Nonlinear Transformations
Polynomial Regression
Regression Splines
Nonparametric Regression
Generalized Additive Models
Chapter 9: Interaction Effects in Linear Models
Understanding Interaction Effects
Interactions Between Two Categorical Variables
Interactions Between One Categorical Variable and One Quantitative Variable
Interactions Between Two Continuous Variables
Interaction Effects: Some Cautions and Recommendations
Part C: The Generalized Linear Model and Extensions
Chapter 10: Generalized Linear Models
Basics of the Generalized Linear Model
Maximum Likelihood Estimation
Hypothesis tests and confidence intervals
Assessing Model Fit
Empirical Example: Using Poisson Regression to Predict Counts
Understanding Effects of Variables
Measuring Variable Importance
Model Diagnostics
Chapter 11: Categorical Dependent Variables
Regression Models for Binary Outcomes
Interpreting Effects in Logit and Probit Models
Model Fit for Binary Regression Models
Diagnostics Specific to Binary Regression Models
Extending the Binary Regression Model - Ordered and Multinomial Models
Chapter 12: Conclusions and Recommendations
Choosing the Right Estimator
Research Design and Measurement Issues
Evaluating the Model
Effective Presentation of Results
Chapter 1: Some Foundation
What is a 'Model'?
Statistical Inference
Part A: General Principles of Effective Presentation
Chapter 2: Best Practices for Graphs and Tables
When to use Tables and Graphs
Constructing Effective Tables
Constructing Clear and Informative Graphs
Chapter 3: Methods for Visualizing Distributions
Displaying the Distributions of Categorical Variables
Displaying Distributions of Quantitative Variables
Transformations
Chapter 4: Exploring and Describing Relationships
Two Categorical Variables
Categorical Explanatory Variable and Quantitative Dependent Variable
Two quantitative Variables
Multivariate Displays
Part B: The Linear Model
Chapter 5: The Linear Regression Model
Ordinary Least Squares Regression
Hypothesis tests and confidence intervals
Assessing and Comparing Model Fit
Relative Importance of Predictors
Interpreting and presenting OLS models: Some empirical examples
Linear Probability Model
Chapter 6: Assessing the Impact and Importance of Multi-category Explanatory Variables
Coding Multi-category Explanatory Variables
Revisiting Statistical Significance: Multi-category Predictors
Relative importance of sets of regressors
Graphical Presentation of Additive Effects
Chapter 7: Identifying and Handling Problems in Linear Models
Nonlinearity
Influential Observations
Heteroskedasticity
Nonnormality
Chapter 8: Modelling and Presentation of Curvilinear Effects
Curvilinearity in the Linear Model Framework
Nonlinear Transformations
Polynomial Regression
Regression Splines
Nonparametric Regression
Generalized Additive Models
Chapter 9: Interaction Effects in Linear Models
Understanding Interaction Effects
Interactions Between Two Categorical Variables
Interactions Between One Categorical Variable and One Quantitative Variable
Interactions Between Two Continuous Variables
Interaction Effects: Some Cautions and Recommendations
Part C: The Generalized Linear Model and Extensions
Chapter 10: Generalized Linear Models
Basics of the Generalized Linear Model
Maximum Likelihood Estimation
Hypothesis tests and confidence intervals
Assessing Model Fit
Empirical Example: Using Poisson Regression to Predict Counts
Understanding Effects of Variables
Measuring Variable Importance
Model Diagnostics
Chapter 11: Categorical Dependent Variables
Regression Models for Binary Outcomes
Interpreting Effects in Logit and Probit Models
Model Fit for Binary Regression Models
Diagnostics Specific to Binary Regression Models
Extending the Binary Regression Model - Ordered and Multinomial Models
Chapter 12: Conclusions and Recommendations
Choosing the Right Estimator
Research Design and Measurement Issues
Evaluating the Model
Effective Presentation of Results
Is your quantitative work so screamingly clear that your readers never misunderstand your figures, misread your tables, or get confused by your prose? If so, then don't waste your time with Andersen and Armstrong's thoughtful book about the effective presentation and interpretation of statistical results. Gary King 20210627