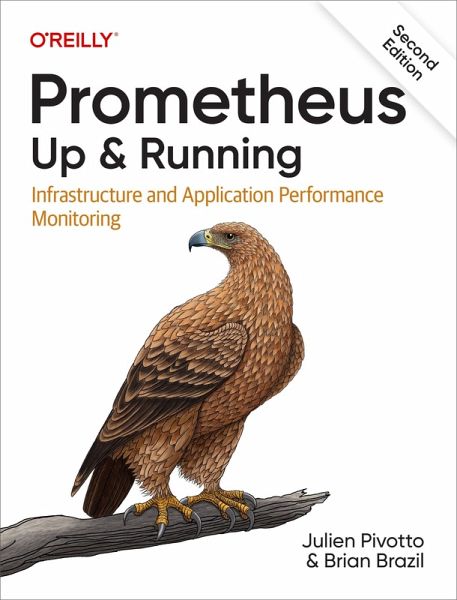
Prometheus: Up & Running (eBook, ePUB)
Versandkostenfrei!
Sofort per Download lieferbar
35,95 €
inkl. MwSt.
Weitere Ausgaben:

PAYBACK Punkte
18 °P sammeln!
Get up to speed with Prometheus, the metrics-based monitoring system used in production by tens of thousands of organizations. This updated second edition provides site reliability engineers, Kubernetes administrators, and software developers with a hands-on introduction to the most important aspects of Prometheus, including dashboarding and alerting, direct code instrumentation, and metric collection from third-party systems with exporters.Prometheus server maintainer Julien Pivotto and core developer Brian Brazil demonstrate how you can use Prometheus for application and infrastructure monit...
Get up to speed with Prometheus, the metrics-based monitoring system used in production by tens of thousands of organizations. This updated second edition provides site reliability engineers, Kubernetes administrators, and software developers with a hands-on introduction to the most important aspects of Prometheus, including dashboarding and alerting, direct code instrumentation, and metric collection from third-party systems with exporters.
Prometheus server maintainer Julien Pivotto and core developer Brian Brazil demonstrate how you can use Prometheus for application and infrastructure monitoring. This book guides you through Prometheus setup, the Node Exporter, and the Alertmanager, and then shows you how to use these tools for application and infrastructure monitoring. You''ll understand why this open source system has continued to gain popularity in recent years.
You will:
- Know where and how much instrumentation to apply to your application code
- Monitor your infrastructure with Node Exporter and use new collectors for network system pressure metrics
- Get an introduction to Grafana, a popular tool for building dashboards
- Use service discovery and the new HTTP SD monitoring system to provide different views of your machines and services
- Use Prometheus with Kubernetes and examine exporters you can use with containers
- Discover Prom''s new improvements and features, including trigonometry functions
- Learn how Prometheus supports important security features including TLS and basic authentication
Dieser Download kann aus rechtlichen Gründen nur mit Rechnungsadresse in A, B, BG, CY, CZ, D, DK, EW, E, FIN, F, GR, HR, H, IRL, I, LT, L, LR, M, NL, PL, P, R, S, SLO, SK ausgeliefert werden.


