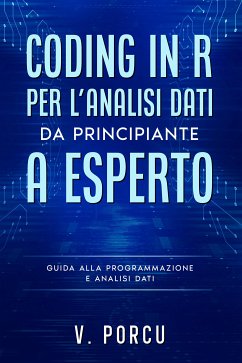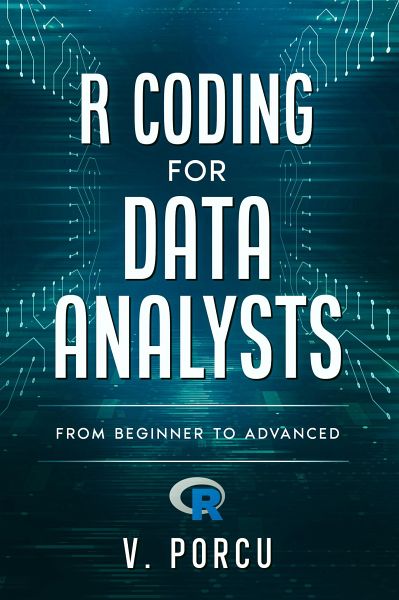
R coding for data analysts (eBook, ePUB)
from beginner to advanced
Sofort per Download lieferbar
15,99 €
inkl. MwSt.

PAYBACK Punkte
0 °P sammeln!
This book on coding with R for aspiring data analysts is designed to be a guide in this programming language from the basics. By the end of this book, you will be able to create, import, manipulate and manage datasets. We will learn together how to download, install and use some of the most important tools and libraries for using R. We will then move on to the creation of objects: R is based on certain structures that you need to know, such as vectors, matrices, lists and dataframes. Once we understand how to create and manipulate these data structures, extract elements from them and save them...
This book on coding with R for aspiring data analysts is designed to be a guide in this programming language from the basics. By the end of this book, you will be able to create, import, manipulate and manage datasets. We will learn together how to download, install and use some of the most important tools and libraries for using R. We will then move on to the creation of objects: R is based on certain structures that you need to know, such as vectors, matrices, lists and dataframes. Once we understand how to create and manipulate these data structures, extract elements from them and save them locally on the computer, we will move on to the use of loops and the creation of functions.
We will look at a number of useful topics: how to set up a working directory, how to install and retrieve a package, how to get information about data, where to find datasets for testing, and how to get help with a function. When analysing data, we need to understand the concept of dataset or dataframe. We will therefore see how to import a dataframe from your computer, or from the internet, into R. There are many functions that are suitable for this purpose, and many packages that are useful for importing data that is in some particular format, such as the formats for Excel, .csv, .txt or JSON. We will then see how to manipulate data, create new variables, aggregate data, sort them horizontally and longitudinally, and how to merge two datasets. To do this, we will use some specific packages and functions, such as dplyr, tidyr or reshape2. We will also briefly see how to interface with a database and use other packages to streamline the management of somewhat larger datasets.
R is also a very important language in the field of statistics. We will therefore learn some of the basic functions, such as calculating averages per row or per column, and the most common statistical functions in the field of descriptive statistics. When it comes to data analysis, we will often find ourselves creating graphs to explain our data and analyses. For this reason, we devote part of the book to seeing how to create graphs with both the functions of the basic library and the ggplot2 package. In the final sections, we will see how to create and export reports and slides, summarise the topics we have seen and the functions we have used, and look at the supporting material.


