19,95 €
19,95 €
inkl. MwSt.
Sofort per Download lieferbar
payback
10 °P sammeln
19,95 €
19,95 €
inkl. MwSt.
Sofort per Download lieferbar

Alle Infos zum eBook verschenken
payback
10 °P sammeln
Als Download kaufen
19,95 €
inkl. MwSt.
Sofort per Download lieferbar
payback
10 °P sammeln
Jetzt verschenken
19,95 €
inkl. MwSt.
Sofort per Download lieferbar

Alle Infos zum eBook verschenken
payback
10 °P sammeln
  • Format: PDF

R has undergone an explosion of popularity around the world. The wide range of graphs and options for creating high-impact visualizations makes R a highly effective tool for researchers, data analysts, students, and others.This book starts with the basics of R and the principles of creating graphics, focusing on scatterplots and line graphs for research and data analysis.After that you will learn how to include mathematical expressions on your graphs and create bar charts, histograms, boxplots, and so on using advanced functions. The book then dives deeper into shading and coloring your graphs…mehr

  • Geräte: PC
  • mit Kopierschutz
  • eBook Hilfe
  • Größe: 1.79MB
  • FamilySharing(5)
Produktbeschreibung
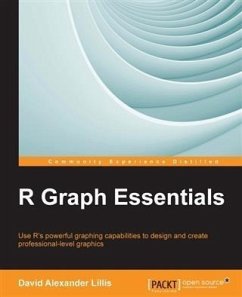
R has undergone an explosion of popularity around the world. The wide range of graphs and options for creating high-impact visualizations makes R a highly effective tool for researchers, data analysts, students, and others.This book starts with the basics of R and the principles of creating graphics, focusing on scatterplots and line graphs for research and data analysis.After that you will learn how to include mathematical expressions on your graphs and create bar charts, histograms, boxplots, and so on using advanced functions. The book then dives deeper into shading and coloring your graphs and labeling points on graphs using the qplot function. After that you will learn how to use the ggplot package to control symbol color, size, shape, and many other attributes.By the end of this book, you will have expert skills to create attractive and informative graphics and design professional-level graphs.

Dieser Download kann aus rechtlichen Gründen nur mit Rechnungsadresse in A, B, BG, CY, CZ, D, DK, EW, E, FIN, F, GR, HR, H, IRL, I, LT, L, LR, M, NL, PL, P, R, S, SLO, SK ausgeliefert werden.

Autorenporträt
David Alexander Lillis is an experienced researcher and statistician, having worked in research evaluation, agricultural and forestry statistics, and education research and statistics. Currently, David delivers lectures in mathematics, statistics, and research methods at the New Zealand Institute of Sport in New Zealand. He is the owner and Director of Sigma Statistics and Research Limited, a New Zealand-based consultancy specializing in training, software development, data analysis, and statistical modelling using R. David holds an Honor's degree and Master's degree in Physics and Mathematics, and a PhD from Curtin University in Perth, Australia.