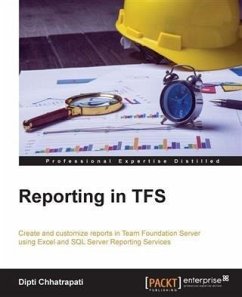
This book starts with giving the reader a walkthrough of TFS and the reporting architecture, guiding you to master the comprehensive reports that are part of Team Foundation Server.You will explore the Team Project Scenario with work item queries, flat queries, direct link queries, and tree queries. Moving ahead, you will learn about the Excel reporting generation process and how to create ad hoc queries and reports in Microsoft Excel to help manage a team project. Microsoft Excel allows users to connect to the TFS Data and display results as a PivotTable or PivotChart report. Then the book describes each of the standard report dashboards such as SharePoint Dashboard, Project Dashboard, Progress Dashboard, Quality Dashboard, Test Dashboard, Bugs Dashboard, and Build Dashboard. Finally, you will learn how to use the powerful tools available in SQL Server Reporting Services to create and customize robust reports and also learn how to design and customize a dashboard of reports relevant to you.
Dieser Download kann aus rechtlichen Gründen nur mit Rechnungsadresse in A, B, BG, CY, CZ, D, DK, EW, E, FIN, F, GR, HR, H, IRL, I, LT, L, LR, M, NL, PL, P, R, S, SLO, SK ausgeliefert werden.


