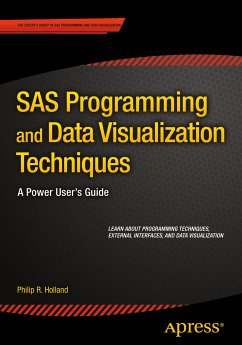
Author Philip R. Holland advises a broad range of clients throughout Europe and the United States as an independent consultant and founder of Holland Numerics Ltd, a SAS technical consultancy. In this book he explains techniques-through code samples and example-that will enable you to increase your knowledge of all aspects of SAS programming, improve your coding productivity, and interface SAS with other programs.
He also provides an expert's overview of Graph Templates, which was recently moved into Base SAS. You will learn to create attractive, standardized, reusable, and platform-independent graphs-both statistical and non-statistical-to help you and your business users explore, visualize, and capitalize on your company's data. In addition, you will find many examples and cases pertaining to healthcare, finance, retail, and other industries.
Among other things, SAS Programming and Data Visualization Techniques will show you how to:
- Write efficient and reus
What You'll Learn
- How to write more efficient SAS code-either code that runs quicker, code that is easier to maintain, or both
- How to do more with the SAS components you already license
- How to take advantage of the newest features in SAS
- How to interface external applications with SAS software
- How to create graphs using SAS ODS Graphics
Who This Book Is For
SAS programmers wanting to improve their existing programming skills, and programming managers wanting to make better use of the SAS software they already license.
Dieser Download kann aus rechtlichen Gründen nur mit Rechnungsadresse in A, B, BG, CY, CZ, D, DK, EW, E, FIN, F, GR, HR, H, IRL, I, LT, L, LR, M, NL, PL, P, R, S, SLO, SK ausgeliefert werden.
Hinweis: Dieser Artikel kann nur an eine deutsche Lieferadresse ausgeliefert werden.

