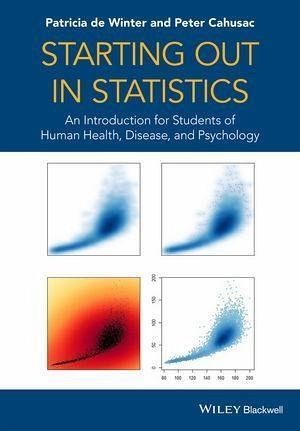
Starting out in Statistics (eBook, PDF)
An Introduction for Students of Human Health, Disease, and Psychology
Alle Infos zum eBook verschenken
Starting out in Statistics (eBook, PDF)
An Introduction for Students of Human Health, Disease, and Psychology
- Format: PDF
- Merkliste
- Auf die Merkliste
- Bewerten Bewerten
- Teilen
- Produkt teilen
- Produkterinnerung
- Produkterinnerung
Hier können Sie sich einloggen
Bitte loggen Sie sich zunächst in Ihr Kundenkonto ein oder registrieren Sie sich bei bücher.de, um das eBook-Abo tolino select nutzen zu können.
To form a strong grounding in human-related sciences it is essential for students to grasp the fundamental concepts of statistical analysis, rather than simply learning to use statistical software. Although the software is useful, it does not arm a student with the skills necessary to formulate the experimental design and analysis of a research project in later years of study or indeed, if working in research. This textbook deftly covers a topic that many students find difficult. With an engaging and accessible style it provides the necessary background and tools for students to use statistics…mehr
- Geräte: PC
- mit Kopierschutz
- eBook Hilfe
- Größe: 4.65MB
Dieser Download kann aus rechtlichen Gründen nur mit Rechnungsadresse in A, B, BG, CY, CZ, D, DK, EW, E, FIN, F, GR, HR, H, IRL, I, LT, L, LR, M, NL, PL, P, R, S, SLO, SK ausgeliefert werden.
- Produktdetails
- Verlag: John Wiley & Sons
- Seitenzahl: 312
- Erscheinungstermin: 4. September 2014
- Englisch
- ISBN-13: 9781118920381
- Artikelnr.: 41495440
- Verlag: John Wiley & Sons
- Seitenzahl: 312
- Erscheinungstermin: 4. September 2014
- Englisch
- ISBN-13: 9781118920381
- Artikelnr.: 41495440
- Herstellerkennzeichnung Die Herstellerinformationen sind derzeit nicht verfügbar.
Basic Maths for Stats Revision xv
Statistical Software Packages xxiii
About the Companion Website xxv
1 Introducing Variables, Populations and Samples - 'Variability is the Law
of Life' 1
1.1 Aims 1
1.2 Biological data vary 1
1.3 Variables 3
1.4 Types of qualitative variables 4
1.4.1 Nominal variables 4
1.4.2 Multiple response variables 4
1.4.3 Preference variables 5
1.5 Types of quantitative variables 5
1.5.1 Discrete variables 5
1.5.2 Continuous variables 6
1.5.3 Ordinal variables - a moot point 6
1.6 Samples and populations 6
1.7 Summary 10
Reference 10
2 Study Design and Sampling - 'Design is Everything. Everything!' 11
2.1 Aims 11
2.2 Introduction 11
2.3 One sample 13
2.4 Related samples 13
2.5 Independent samples 14
2.6 Factorial designs 15
2.7 Observational study designs 17
2.7.1 Cross-sectional design 17
2.7.2 Case-control design 17
2.7.3 Longitudinal studies 18
2.7.4 Surveys 18
2.8 Sampling 19
2.9 Reliability and validity 20
2.10 Summary 21
References 23
3 Probability - 'Probability ... So True in General' 25
3.1 Aims 25
3.2 What is probability? 25
3.3 Frequentist probability 26
3.4 Bayesian probability 31
3.5 The likelihood approach 35
3.6 Summary 36
References 37
4 Summarising Data - 'Transforming Data into Information' 39
4.1 Aims 39
4.2 Why summarise? 39
4.3 Summarising data numerically - descriptive statistics 41
4.3.1 Measures of central location 41
4.3.2 Measures of dispersion 47
4.4 Summarising data graphically 54
4.5 Graphs for summarising group data 55
4.5.1 The bar graph 55
4.5.2 The error plot 56
4.5.3 The box-and-whisker plot 57
4.5.4 Comparison of graphs for group data 58
4.5.5 A little discussion on error bars 59
4.6 Graphs for displaying relationships between variables 59
4.6.1 The scatter diagram or plot 60
4.6.2 The line graph 62
4.7 Displaying complex (multidimensional) data 63
4.8 Displaying proportions or percentages 64
4.8.1 The pie chart 64
4.8.2 Tabulation 64
4.9 Summary 66
References 66
5 Statistical Power - '. . . Find out the Cause of this Effect' 67
5.1 Aims 67
5.2 Power 67
5.3 From doormats to aortic valves 70
5.4 More on the normal distribution 72
5.4.1 The central limit theorem 77
5.5 How is power useful? 79
5.5.1 Calculating the power 80
5.5.2 Calculating the sample size 82
5.6 The problem with p values 84
5.7 Confidence intervals and power 85
5.8 When to stop collecting data 87
5.9 Likelihood versus null hypothesis testing 88
5.10 Summary 91
References 92
6 Comparing Groups using t-Tests and ANOVA - 'To Compare is not to Prove'
93
6.1 Aims 93
6.2 Are men taller than women? 94
6.3 The central limit theorem revisited 97
6.4 Student's t-test 98
6.4.1 Calculation of the pooled standard deviation 102
6.4.2 Calculation of the t statistic 103
6.4.3 Tables and tails 104
6.5 Assumptions of the t-test 107
6.6 Dependent t-test 109
6.7 What type of data can be tested using t-tests? 110
6.8 Data transformations 110
6.9 Proof is not the answer 111
6.10 The problem of multiple testing 111
6.11 Comparing multiple means - the principles of analysis of variance 112
6.11.1 Tukey's honest significant difference test 120
6.11.2 Dunnett's test 121
6.11.3 Accounting for identifiable sources of error in one-way ANOVA:
nested design 123
6.12 Two-way ANOVA 126
6.12.1 Accounting for identifiable sources of error using a two-way ANOVA:
randomised complete block design 130
6.12.2 Repeated measures ANOVA 133
6.13 Summary 133
References 134
7 Relationships between Variables: Regression and Correlation - 'In
Relationships . . . Concentrate only on what is most Significant and
Important' 135
7.1 Aims 135
7.2 Linear regression 136
7.2.1 Partitioning the variation 139
7.2.2 Calculating a linear regression 141
7.2.3 Can weight be predicted by height? 145
7.2.4 Ordinary least squares versus reduced major axis regression 152
7.3 Correlation 153
7.3.1 Correlation or linear regression? 154
7.3.2 Covariance, the heart of correlation analysis 154
7.3.3 Pearson's product-moment correlation coefficient 156
7.3.4 Calculating a correlation coefficient 157
7.3.5 Interpreting the results 159
7.3.6 Correlation between maternal BMI and infant birth weight 160
7.3.7 What does this correlation tell us and what does it not? 161
7.3.8 Pitfalls of Pearson's correlation 162
7.4 Multiple regression 164
7.5 Summary 174
References 174
8 Analysis of Categorical Data - 'If the Shoe Fits . . . ' 175
8.1 Aims 175
8.2 One-way chi-squared 175
8.3 Two-way chi-squared 179
8.4 The odds ratio 186
8.5 Summary 191
References 192
9 Non-Parametric Tests - 'An Alternative to other Alternatives' 193
9.1 Aims 193
9.2 Introduction 193
9.3 One sample sign test 195
9.4 Non-parametric equivalents to parametric tests 199
9.5 Two independent samples 199
9.6 Paired samples 203
9.7 Kruskal-Wallis one-way analysis of variance 207
9.8 Friedman test for correlated samples 211
9.9 Conclusion 214
9.10 Summary 214
References 215
10 Resampling Statistics comes of Age - 'There's always a Third Way' 217
10.1 Aims 217
10.2 The age of information 217
10.3 Resampling 218
10.3.1 Randomisation tests 219
10.3.2 Bootstrapping 222
10.3.3 Comparing two groups 227
10.4 An introduction to controlling the false discovery rate 229
10.5 Summary 231
References 231
Appendix A: Data Used for Statistical Analyses (Chapters 6,7 and 10) 233
Appendix B: Statistical Software Outputs (Chapters 6-9) 243
Index 279