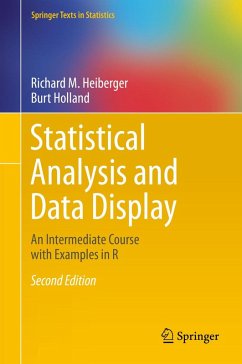
This contemporary presentation of statistical methods features
extensive use of graphical displays for exploring data and for
displaying the analysis. The authors demonstrate how to analyze
data-showing code, graphics, and accompanying tabular listings-for
all the methods they cover. They emphasize how to construct and
interpret graphs. They discuss principles of graphical design. They
identify situations where visual impressions from graphs may need
confirmation from traditional tabular results. All chapters have
exercises.
The authors provide and discuss R functions for all the new graphical
display formats. All graphs and tabular output in the book were
constructed using these functions. Complete R scripts for all examples
and figures are provided for readers to use as models for their own
analyses.
This book can serve as a standalone text for statistics majors at the
master's level and for other quantitatively oriented disciplines at
the doctoral level, and as a reference book for researchers. In-depth
discussions of regression analysis, analysis of variance, and design
of experiments are followed by introductions to analysis of discrete
bivariate data, nonparametrics, logistic regression, and ARIMA time
series modeling. The authors illustrate classical concepts and
techniques with a variety of case studies using both newer graphical
tools and traditional tabular displays.
The Second Edition features graphs that are completely redrawn using
the more powerful graphics infrastructure provided by R's lattice
package. There are new sections in several of the chapters, revised
sections in all chapters and several completely new appendices.
New graphical material includes:
. an expanded chapter on graphics;
. a section on graphing Likert Scale Data to build on the importance of
rating scales in fields from population studies to psychometrics;
. a discussion on design of graphics that will work for readers with
color-deficient vision;
. an expanded discussion on the design of multi-panel graphics;
. expanded and new sections in the discrete bivariate statistics chapter
on the use of mosaic plots for contingency tables including the n×2×2
tables for which the Mantel-Haenszel-Cochran test is appropriate;
. an interactive (using the shiny package) presentation of the graphics
for the normal and t-tables that is introduced early and used in many
chapters.
The new appendices include discussions of R, the HH package
designed for R (the material in the HH package was distributed as a
set of standalone functions with the First Edition of this book), the
R Commander package, the RExcel system, the shiny package, and a
minimal discussion on writing R packages. There is a new appendix on
computational precision illustrating and explaining the FAQ
(Frequently Asked Questions) about the differences between the
familiar real number system and the less-familiar floating point
system used in computers. The probability distributions appendix has
been expanded to include more distributions (all the distributions in
base R) and to include graphs of each. The editing appendix from the
First Edition has been split into four expanded appendices-on working
style, writing style, use of a powerful editor, and use of LaTeX for
document preparation.
Dieser Download kann aus rechtlichen Gründen nur mit Rechnungsadresse in A, B, BG, CY, CZ, D, DK, EW, E, FIN, F, GR, HR, H, IRL, I, LT, L, LR, M, NL, PL, P, R, S, SLO, SK ausgeliefert werden.
"It is a thorough and self-contained book. Keeping with the spirit with earlier edition, the second edition is well organized and structured and builds on statistical knowledge and its appreciation in a logical and concise manner. The book provides a host of useful topics and techniques for students in the niche of statistical analysis and data display. The book can adopted as textbook for an intermediate level statistics course." (S. E. Ahmed, Technometrics, Vol. 58 (3), August, 2016)
From the reviews:
"Heiberger and Holland have produced a comprehensive, well-presented review of essential statistical topics...this is an excellent book for suppporting advanced undergraduate courses on statsitics or data analysis [and] a valuable reference source to researchers..." Biomedical Engineering Online, 2005, 4:18
"Overall, I am impressed with this book and recommend it for graduate statistical methods courses where S-PLUS, R, or SAS is used. There is good incorporation of software tools that complement the statsitical methods presented that go beyond what most statistical methods books provide, a very broad range of topics is covered with examples representing many disciplines, and the emphasis of graphing and presentation of data is excellent." Technometrics, August 2005
"Discussion of each topic begins with a clear and easy-to-read presentation of the relevant theory at a level that statistics majors (and nonmajors) would enjoy..." The American Statistician, August 2005
"Throughout the book, statistical theory is kept to a minimum, and statistical concepts and methods are well stated, without lengthy derivations of formulas, but with the aid of graphical displays. Many examples are provided to illustrate the use of statistical methods. Exercise problems are well written and will be good practice for readers." Biometrics, December 2005
"A notable aspect of this book is the strong emphasis given to presenting data using graphical displays as well as the instructions and programs provided to create these displays in ... . The authors' great emphasis on graphical methods ... of the existing statistical methods books. I am impressed with this book and recommend it for graduate statistical methods courses where S-PLUS, R, or SAS is used. There is good incorporation of software tools .... The emphasis of graphing and presentation of data is excellent." (Theresa L. Utlaut,Technometrics, Vol. 47 (3), August, 2005)
"The statistical analysis in the book is taught on interesting real examples. ... the analysis is quite deep. An extraordinary care is devoted to graphical presentation of results. Many of the graphical formats are novel. ... appendices to the book contain useful remarks on statistical software, typography, and a review of fundamental mathematical concepts. A reader who studies the book and repeats the authors' calculations gains basic statistical skill and knowledge of software for solving similar problems in applications." (EMS - European Mathematical Society Newsletter, December, 2004)
"This is a huge book with huge aims - and the authors managed to get it done. ... is a modern textbook on many statistical methods including theory, with many well selected examples, and with code written for appropriate statistical software ... . It is nice to see a book that tries to explain methods together with the usage of two widely used statistical software systems, namely SAS and the S language. This comprehensive book is a nice all rounder for statistics students ... ." (Uwe Ligges, Statistical Papers, Vol. 47, 2005)
"Although this book is aimed at postgraduate students, it would be equally valuable for non-specialists ... . This book is a review of the most widely used areas of statistics ... . A good feature of this book is that all the datasets used are freely available in online files ... . Therefore, it is possible to carry out the analyses yourself ... . There are many examples, which are well chosen to illustrate the points being made." (D. A. Goodwin, Journal of Applied Statistics, Vol. 33 (7), August, 2006)
"The authors present the book as a 'standalone text for a contemporary year-long course in statistical methods' ... . the core material is of high standard, and the book also brings scientific contributions in terms of novel graph types. ... my overall impression of the book isvery good. I believe that the authors have managed to balance innovativeness and accessibility ... . it is both a valid textbook for students and teachers alike, and a useful reference book for practitioners." (Gaj Vidmar, ISCB News, Issue 41, June, 2006)