52,95 €
52,95 €
inkl. MwSt.
Sofort per Download lieferbar
26 °P sammeln
52,95 €
Als Download kaufen
52,95 €
inkl. MwSt.
Sofort per Download lieferbar
26 °P sammeln
Jetzt verschenken
Alle Infos zum eBook verschenken
52,95 €
inkl. MwSt.
Sofort per Download lieferbar
Alle Infos zum eBook verschenken
26 °P sammeln
- Format: ePub
- Merkliste
- Auf die Merkliste
- Bewerten Bewerten
- Teilen
- Produkt teilen
- Produkterinnerung
- Produkterinnerung
- Weitere 6 Ausgaben:
- Gebundenes Buch
- Broschiertes Buch
- Broschiertes Buch
- eBook, ePUB
- eBook, PDF
- eBook, PDF
Bitte loggen Sie sich zunächst in Ihr Kundenkonto ein oder registrieren Sie sich bei
bücher.de, um das eBook-Abo tolino select nutzen zu können.
Hier können Sie sich einloggen
Sie sind bereits eingeloggt. Klicken Sie auf 2. tolino select Abo, um fortzufahren.
Bitte loggen Sie sich zunächst in Ihr Kundenkonto ein oder registrieren Sie sich bei bücher.de, um das eBook-Abo tolino select nutzen zu können.
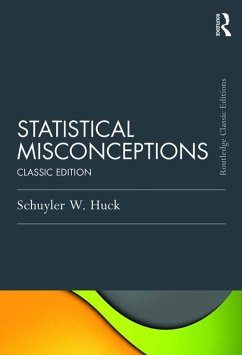
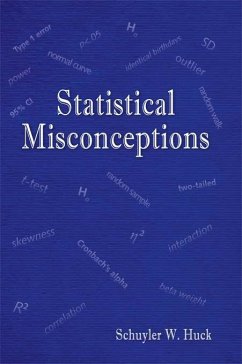
This engaging book helps readers identify and then discard 52 misconceptions about data and statistical summaries.
- Geräte: eReader
- mit Kopierschutz
- eBook Hilfe
- Größe: 2.08MB
This engaging book helps readers identify and then discard 52 misconceptions about data and statistical summaries.
Dieser Download kann aus rechtlichen Gründen nur mit Rechnungsadresse in A, B, BG, CY, CZ, D, DK, EW, E, FIN, F, GR, HR, H, IRL, I, LT, L, LR, M, NL, PL, P, R, S, SLO, SK ausgeliefert werden.
Produktdetails
- Produktdetails
- Verlag: Taylor & Francis
- Seitenzahl: 320
- Erscheinungstermin: 19. November 2015
- Englisch
- ISBN-13: 9781317311553
- Artikelnr.: 49353242
- Verlag: Taylor & Francis
- Seitenzahl: 320
- Erscheinungstermin: 19. November 2015
- Englisch
- ISBN-13: 9781317311553
- Artikelnr.: 49353242
- Herstellerkennzeichnung Die Herstellerinformationen sind derzeit nicht verfügbar.
Schuyler W. Huck is Distinguished Professor and Chancellor's Teaching Scholar at the University of Tennessee - Knoxville. A prolific author on improving statistical instruction and helping consumers decipher research reports, his publications have been cited in over 337 journals.
Introduction to the Classic Edition. Part 1. Descriptive Statistics. 1.1.
Measures of Central Tendency. 1.2. The Mean of Means. 1.3. The Mode's
Location. 1.4. The Standard Deviation. Part 2. Distributional Shape. 2.1.
The Shape of the Normal Curve. 2.2. Skewed Distributions and Measures of
Central Tendency. 2.3. Standard Scores and Normality. 2.4. Rectangular
Distributions and Kurtosis. Part 3. Bivariate Correlation. 3.1. Correlation
Coefficients. 3.2. Correlation and Causality. 3.3. The Effect of a Single
Outlier on Pearson's r. 3.4. Relationship Strength and r. 3.5. The Meaning
of r = 0. Part 4. Reliability and Validity. 4.1. Statistical Indices of
Reliability and Validity. 4.2. Interrater Reliability. 4.3. Cronbach's
Alpha and Unidimensionality. 4.4. Range Restriction and Predictive
Validity. Part 5. Probability. 5.1. The Binomial Distribution and N. 5.2. A
Random Walk With a Perfectly Fair Coin. 5.3. Two Goats and a Car. 5.4.
Identical Birthdays. 5.5. The Sum of an Infinite Number of Numbers.
5.6.Being Diagnosed With a Rare Disease. 5.7. Risk Ratios and Odds Ratios.
Part 6. Sampling. 6.1.The Character of Random Samples. 6.2. Random
Replacements When Sampling. 6.3 Precision and the Sampling Fraction. 6.4.
Matched Samples. 6.5. Finite Versus Infinite Populations. Part 7.
Estimation. 7.1. Interpreting a Confidence Interval. 7.2. Overlapping
Confidence Intervals. 7.3. The Mean ± the Standard Error. 7.4. Confidence
Intervals and Replication. Part 8. Hypothesis Testing. 8.1. Alpha and Type
I Error Risk. 8.2. The Null Hypothesis. 8.3.Disproving Ho. 8.4. The Meaning
of p. 8.5. Directionality and Tails. 8.6. The Relationship Between Alpha
and Beta Errors. Part 9. t-Tests Involving One or Two Means.
9.1.Correlated t-Tests. 9.2. The Difference Between Two Means If p <
.00001. 9.3. The Robustness of a t-Test When n1 = n2. Part 10. ANOVA and
ANCOVA. 10.1. Pairwise Comparisons. 10.2. The Cause of a Significant
Interaction. 10.3. Equal Covariate Means in ANCOVA. Part 11. Practical
Significance, Power, and Effect Size. 11.1. Statistical Significance Versus
Practical Significance. 11.2. A Priori and Post Hoc Power. 11.3. Eta
Squared and Partial Eta Squared. Part 12. Regression. 12.1. Comparing Two
rs; Comparing Two bs. 12.2. R2. 12.3. Predictor Variables that Are
Uncorrelated with Y. 12.4. Beta Weights.