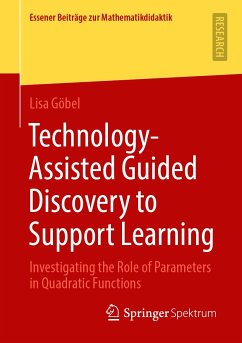
Technology is becoming more and more integrated in mathematics teaching and the use of technology is explicitly demanded by the curricula. Technology can be for example integrated while conceptualizing parameters of quadratic functions. In this thesis three technical visualizations (classic function plotter, drag mode, and sliders) for the manipulation of parameters of quadratic functions shall be compared with an access without the possibility of technical visualization. For this purpose, a Guided Discovery environment was developed, which was conducted in an intervention study with 14 classes of grade 9 (N=383). Different strengths and weaknesses of the individual visualizations in favor of the dynamic visualizations by drag mode and slider are shown. Also, different potentials and constraints of the use of technology are visible, for example the students use the technology to test their own hypotheses that were generated through the use of technology.
The author
Lisa Göbel completed her dissertation as a research assistant under Prof. Dr. Bärbel Barzel in the Mathematics Education department at the University of Duisburg-Essen. Her interests include functional thinking and the use of technology in mathematics teaching.
Dieser Download kann aus rechtlichen Gründen nur mit Rechnungsadresse in A, B, BG, CY, CZ, D, DK, EW, E, FIN, F, GR, HR, H, IRL, I, LT, L, LR, M, NL, PL, P, R, S, SLO, SK ausgeliefert werden.
Es gelten unsere Allgemeinen Geschäftsbedingungen: www.buecher.de/agb
Impressum
www.buecher.de ist ein Internetauftritt der buecher.de internetstores GmbH
Geschäftsführung: Monica Sawhney | Roland Kölbl | Günter Hilger
Sitz der Gesellschaft: Batheyer Straße 115 - 117, 58099 Hagen
Postanschrift: Bürgermeister-Wegele-Str. 12, 86167 Augsburg
Amtsgericht Hagen HRB 13257
Steuernummer: 321/5800/1497
USt-IdNr: DE450055826
Bitte wählen Sie Ihr Anliegen aus.
Rechnungen
Retourenschein anfordern
Bestellstatus
Storno

