9,95 €
9,95 €
inkl. MwSt.
Sofort per Download lieferbar
payback
5 °P sammeln
9,95 €
9,95 €
inkl. MwSt.
Sofort per Download lieferbar

Alle Infos zum eBook verschenken
payback
5 °P sammeln
Als Download kaufen
9,95 €
inkl. MwSt.
Sofort per Download lieferbar
payback
5 °P sammeln
Jetzt verschenken
9,95 €
inkl. MwSt.
Sofort per Download lieferbar

Alle Infos zum eBook verschenken
payback
5 °P sammeln
  • Format: ePub

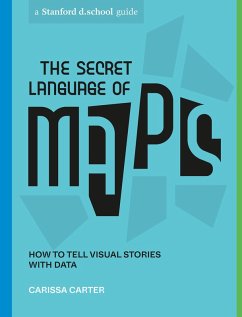
A highly visual exploration of diagrams and data that helps you understand how "maps" are part of everyday thinking, how they tell stories, and how they can reframe your point of view, from Stanford University's world-renowned d.school. "This book is the ultimate legend to mapping all kinds of data."-Jessica Hagy, Webby Award-winning blogger of Indexed and author of How to Be Interesting (In Ten Simple Steps) Maps aren't just geographic, they are also infographic and include all types of frameworks and diagrams. Any figure that sorts data visually and presents it spatially is a map. Maps are…mehr

  • Geräte: eReader
  • ohne Kopierschutz
  • eBook Hilfe
  • Größe: 19.45MB
  • FamilySharing(5)
Produktbeschreibung
A highly visual exploration of diagrams and data that helps you understand how "maps" are part of everyday thinking, how they tell stories, and how they can reframe your point of view, from Stanford University's world-renowned d.school. "This book is the ultimate legend to mapping all kinds of data."-Jessica Hagy, Webby Award-winning blogger of Indexed and author of How to Be Interesting (In Ten Simple Steps) Maps aren't just geographic, they are also infographic and include all types of frameworks and diagrams. Any figure that sorts data visually and presents it spatially is a map. Maps are ways of organizing information and figuring out what's important. Even stories can be mapped! The Secret Language of Maps provides a simple framework to deconstruct existing maps and then shows you how to create your own. An embedded mystery story about a woman who investigates the disappearance of an old high school friend illustrates how to use different maps to make sense of all types of information. Colorful illustrations bring the story to life and demonstrate how the fictional character's collection of data, properly organized and "mapped," leads her to solve the mystery of her friend's disappearance. You'll learn how to gather data, organize it, and present it to an audience. You'll also learn how to view the many maps that swirl around our daily lives with a critical eye, aware of the forces that are in play for every creator.

Dieser Download kann aus rechtlichen Gründen nur mit Rechnungsadresse in A, B, BG, CY, CZ, D, DK, EW, E, FIN, F, GR, HR, H, IRL, I, LT, L, LR, M, NL, PL, P, R, S, SLO, SK ausgeliefert werden.

Autorenporträt
Carissa Carter is a designer, geoscientist, and Academic Director at the Stanford d.school. Carissa drives the d.school's pedagogy and teaches courses on the intersection of data and design, design for climate change, maps, and the visual sorting of information. She helped lead the d.school's seminal Stanford 2025 project on the future of higher education and pursues projects at the crossover between design, science, and emerging technology. The Hasso Plattner Institute of Design, known as the d.school, was founded at Stanford University in 2005. Each year, more than a thousand students from all disciplines attend classes, workshops, and programs to learn how the thinking behind design can enrich their own work and unlock their creative potential.