The Sensible Guide to Forex (eBook, PDF)
Safer, Smarter Ways to Survive and Prosper from the Start
The Sensible Guide to Forex (eBook, PDF)
Safer, Smarter Ways to Survive and Prosper from the Start
- Format: PDF
- Merkliste
- Auf die Merkliste
- Bewerten Bewerten
- Teilen
- Produkt teilen
- Produkterinnerung
- Produkterinnerung
Hier können Sie sich einloggen
Bitte loggen Sie sich zunächst in Ihr Kundenkonto ein oder registrieren Sie sich bei bücher.de, um das eBook-Abo tolino select nutzen zu können.
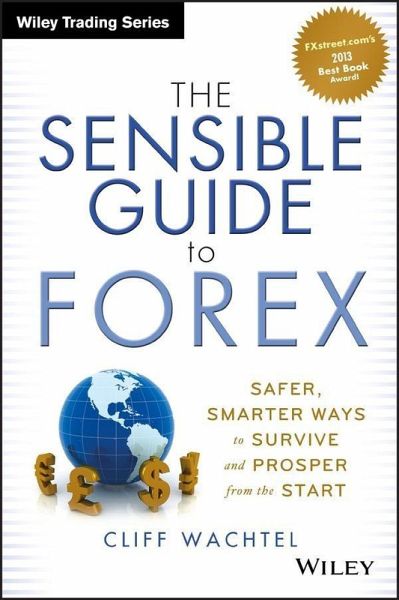
FXstreet.Com's 2013 Best Book Award! The Sensible Guide to Forex: Safer, Smarter Ways to Survive and Prosper from the Start is written for the risk averse, mainstream retail investor or trader seeking a more effective way to tap forex markets to improve returns and hedge currency risk. As the most widely held currencies are being devalued, they're taking your portfolio down with them--unless you're prepared. For traders, the book focuses on reducing the high risk, complexity, and time demands normally associated with forex trading. For long-term investors, it concentrates on how to hedge…mehr
- Geräte: PC
- mit Kopierschutz
- eBook Hilfe
- Größe: 41.34MB
- Kathy LienThe Little Book of Currency Trading (eBook, PDF)18,99 €
- John L. PersonA Complete Guide to Technical Trading Tactics (eBook, PDF)54,99 €
- Lewis BorsellinoThe Day Trader's Course (eBook, PDF)61,99 €
- Fausto PuglieseHow to Beat the Market Makers at Their Own Game (eBook, PDF)40,99 €
- Stephen BrieseThe Commitments of Traders Bible (eBook, PDF)54,99 €
- Constance BrownMastering Elliott Wave Principle (eBook, PDF)50,99 €
- Thomas N. BulkowskiEncyclopedia of Candlestick Charts (eBook, PDF)114,99 €
-
-
-
Dieser Download kann aus rechtlichen Gründen nur mit Rechnungsadresse in A, B, BG, CY, CZ, D, DK, EW, E, FIN, F, GR, HR, H, IRL, I, LT, L, LR, M, NL, PL, P, R, S, SLO, SK ausgeliefert werden.
- Produktdetails
- Verlag: John Wiley & Sons
- Seitenzahl: 448
- Erscheinungstermin: 27. August 2012
- Englisch
- ISBN-13: 9781118226056
- Artikelnr.: 37344718
- Verlag: John Wiley & Sons
- Seitenzahl: 448
- Erscheinungstermin: 27. August 2012
- Englisch
- ISBN-13: 9781118226056
- Artikelnr.: 37344718
Currency Risk: Every Investor's Dilemma xix
Currency Risk and How to Fight It xx
The Solution xx
Some Background xxi
Why Any Trader or Investor Needs This Book xxii
What This Book Offers xxiv
Why Listen to You, Cliff? xxv
Visit thesensibleguidetoforex.com for Additional
Online Content xxviii
Acknowledgments xxxi
CHAPTER 1 Three Must-Know Forex Facts 1
Fact 1: Everyone Needs Forex Diversification Even if You
Don't Trade Actively 2
You're Exposed: Cover Your Assets 2
Even Long-Term Buy-and-Hold Investors Need Forex Diversification 3
Fact 2: Potential for Better Risk-Adjusted Returns 4
Forex Markets Often Provide Advanced Warnings of Changes in Other Markets 4
Forex Needn't Be Any Riskier Than Other Markets 4
No Uptick Rule: Just as Easy to Profit in a Falling Market as in a Rising
One 5
Low Correlation to Other Financial Markets 7
The Most Flexible Hours 7
Forex Markets Offer the Best Liquidity 8
No Centralized Exchange with Specialists Holding Monopoly Power to Regulate
Prices 9
Less Slippage 9
The Best Risk/Reward Potential 9
The Lowest Startup and Trading Costs 10
Fact 3: You Can Do This 11
How Can I Compete against the Pros and Big Institutions? 11
How David Beats Goliath: More on What This Book Will and Won't Do 12
What's the Catch? 14
Most Traders Fail within Their First Two Years 14
CHAPTER 2 Forex Basics 17
Basics of Currencies and Currency Pairs 17
Trade Only the Most Liquid Currencies 18
The Major Currencies 18
Risk versus Safe Haven Currencies: Definition and Ranking 19
Currencies Trade in Pairs and Why That Matters 20
Price Movements Are Always Relative to Another Currency 20
It's Just as Easy to Profit in Bear Markets as in Bull Markets 21
How to Read a Forex Pair Price Quote 22
Summary of Currency Pair Basics 24
Why It's Just as Easy to Profit from Falling Prices 25
Size Matters: Types of Currency Pairs 29
The Major Currency Pairs: The Most Liquid 29
More on Risk and Safe Haven Currencies 29
The Signs of the Crosses: Divine Revelations about Currency Strength 30
Walk on the Wild Side: The Exotics 32
Pips: The Universal Currency of Currencies 32
Calculating Pip Values 33
Three Ways to Limit Risk: Lot Size Usually the Easiest 33
Leverage and Margin: Their Relationship and Impact on Risk 35
Leverage: Greater Risk and Reward 35
Permitted Leverage Varies with Place and Time 35
How Margin, Lot Size, and Leverage Interact 36
The Importance of Adequate Capital 36
Margin Calls: Your account's Circuit Breaker 37
Order Types 38
Exit Orders: Ways to Close a Position 42
The Three Facets of Risk and Risk Control 44
The Core Four: The Most Important Skills for Success 45
Trader Psychology 46
Risk and Money Management (RAMM) 48
Technical and Fundamental Analysis 48
CHAPTER 3 Technical Analysis (TA) Basics 49
Candle Chart Basics 50
Candle Anatomy and Meaning 50
Relationship between Body, Wick, and Its Significance 52
Support and Resistance (S/R) Basics 54
Candle Chart Time Frames: Length Matters 59
Different Time Frames, Different Trading Techniques, and Styles 59
Different Time Frames, Different Trends 60
Identifying Support and Resistance (S/R) to Buy Low, Sell
High, or Vice Versa 62
Definitions of S/R Are Reversed for Long and Short Positions 63
The General Rule for Identifying Low-Risk High-Yield Trades 64
Finding S/R Is Key to Identifying and Executing Low-Risk High-Yield Trades
64
Good Risk Management Requires Good TA 66
Think of S/R as Zones or Areas 66
So Stick to Trading Longer Time Frames-They're Safer 67
Reasons to Consider Using Multiple Entry and Exit Points 68
Once Broken, Resistance Becomes Support and Vice Versa 68
Don't "OD" on TA 69
Why Specialize in a Few Currency Pairs and Time Frames? 69
What Determines Whether a Currency Is a Risk or a Safe Haven? 70
CHAPTER 4 Technical Analysis: Types of Support and Resistance (S/R) 73
Price Levels 74
For Lowest Risk, Enter Near Strong Support 75
What Makes Some S/R Points Stronger Than Others? 76
Longer Time Frames Offer More Reliable S/R Indicators 77
Check Shorter Time Frames to Detect Interim S/R Levels 77
Trends and Trend Lines 80
Trends Vary with Time Frame 80
Defining Trends, and Constructing Trend Lines 80
Types of Trend Lines 81
Single Uptrend or Downtrend Lines 82
Channels: Better Than Single Trend Lines 83
Moving Averages (MAs) 87
Fibonacci Retracements (Fibs): These Fibs Don't Lie 93
Applying Fibs to Your Charts 94
Fibs within Fibs 96
Bollinger Bands (BBs): Use as S/R in Range-Bound Markets 98
Support/Resistance (S/R) for Flat or Gently Sloping Trends: The Bollinger
Bounce 99
Bollinger Bands Don't Provide Meaningful S/R with Strong Trends 100
Introduction to Japanese Candle Chart Patterns 101
More Key Points about Japanese Candle Patterns 107
Context and Timing Matter 107
Introduction to Western Chart Patterns 108
Classic Western Reversal Patterns 108
Beware False Breakouts, Shake Outs, and Other Fake Outs 111
Other Reversal Patterns to Know 112
Classic Western Continuation Patterns 113
We Repeat: False Breakouts Happen 115
Other Continuation Patterns 116
Patterns That Can Be Continuation or Reversal 116
The Underlying Logic of Chart Patterns 116
The More S/R Indicators, the Better 119
Multiple Mutually Reinforcing S/R Indicators: An Example 119
CHAPTER 5 Trader Psychology and Risk and Money Management (RAMM) 123
RAMM: Preserving Capital Is Your Top Priority 124
The Inner Game: Trader Psychology Basics 125
Lesson 1: Seek Trading Styles and Methods That Fit You 126
Lesson 2: Basics of the Trader's Mindset-Minimizing and Accepting Risk 128
Lesson 3: Dealing with Losing and Winning Streaks 129
Why Trade Longer Time Frames 130
Seek Safer Trading Styles 130
As with Driving, Speed Kills 131
A More Level Playing Field 132
More and Better Information Means Better Trade Decisions 134
Trends Are More Reliable in Longer Time Frames 134
Ideal Trends For Long-Term Investors 136
Other Technical Indicators Are Better in Longer Time Frames 137
Publicly Available Fundamental Data and Analysis Matters in Longer Time
Frames 137
Lower Trading Costs 138
Start Out with Longer Duration Trades 138
Content Quality: The Sign of a Quality Broker 139
The Essence of Good RAMM 140
The Three Pillars of RAMM 141
Account Size and Affordable Loss per Trade 142
Setting Stop Losses: Basic Technique and Psychology 142
Where to Set Stop Losses: Two Criteria 142
More Capital Allows Wider Stop Losses and a Wider Choice of Low-Risk Trade
Opportunities 143
Balancing Risk versus the Need to Win 144
Method 1: Recent Range 145
Method 2: Average True Range (ATR) 145
So How Much Capital Is Enough? 146
Leverage and Margin 147
Position Sizing 147
Avoid Having Too Many Open Positions 148
Entries Near Strong Support, Exits Near Strong Resistance 148
Entries 148
Exits: Use Trailing Stops to Protect and Maximize Gains 149
Entries and Exits: Single versus Multiple 149
Risk-Reward Ratios (RRRs) 150
Example: How 1:3 RRRs Make Winners Out of Losers 150
Example: How 1:2 Risk-Reward Ratios Make Winners Out of Losers 152
Applying 1:3 RRR: An Example 154
Acceptable RRR Can Vary with Market Conditions 155
More on Stop Loss Orders: An Example of Using ATR to Gauge Volatility and
Place a Fixed or Trailing Stop Loss Order 156
If You Fail to Plan, You Plan to Fail 158
What's Your Rationale for Taking This Trade? 158
No. 1: Plan Every Trade and Record It in a Journal 160
Sample Trade Rationale as Recorded in Journal 162
No. 2: Your Overall Business Plan 165
What Conditions Do You Need for Success? 166
Safety in Numbers: Build a Team 166
CHAPTER 6 Essentials of Fundamental Analysis 169
Using Fundamental Analysis (FA) and Technical Analysis (TA) Together 171
An Overview of FA: Main Fundamental Drivers of Forex Trends 175
Overall Risk Appetite 176
Short-Term Interest Rates 183
Macroeconomic Data and Indicators 189
Example: EURUSD Uptrend Reverses in Late 2009 as Data Show Europe Slows,
U.S. Grows 189
Geopolitics 193
Capital and Trade Flows 193
Merger and Acquisition (M&A) Activity 194
Short-Term Illiquidity: A Lack of Buyers and Sellers 195
Government and Central Bank Special Interventions in Times of Crisis 196
News Trading: Day Trading Based on Short-Term Fundamentals 197
What News Traders Watch 197
FA Basics: Easy to Understand and Hard to Apply 199
Therefore, Get Thee to an Analyst 200
Combining FA and TA: An Example 200
CHAPTER 7 Pulling It All Together with Trade Examples 205
Identifying and Executing Low-Risk, High Potential
Yield Trades 205
Begin Your Search On Longer Time Frame Charts, Then Zoom In 205
Consider the Fundamental Context 206
Initial Screening on Longer Time Frame Charts 206
Second Screening 208
Third Screening to Monitor Trade Progress 209
Types of Trades 210
Trade Example 1: A Swing Trade 211
Initial Screening 211
Second Screening 213
RRR Evaluation 214
Conclusion: We Take the Trade 216
Trade Postmortem: What Happened 217
Trade Example 2: A Breakout Trade 218
First Screening 218
Second Screening 220
RRR Evaluation 221
Conclusion: Know When to Walk Away 222
Trade Postmortem: Was I Right? 223
More Key Trader Psychology: Distinguishing between Good Trades and Winning
Trades 224
CHAPTER 8 Technical Analysis: Basic Momentum Indicators 227
Double Bollinger Bands (DBBs )-Use as Momentum Indicators 229
DBB Basics 231
The Four Rules for Using Double Bollinger Bands 232
Combine DBBs with a Leading Indicator 236
DBBs: Conclusion and Summary 237
Moving Average Crossovers 237
Price Crosses Over or Under a Moving Average 238
The More Indicators in Our Favor, the Better 239
How Many Indicators Should You Use? 240
But RAMM Is Key 240
Moving Averages Cross Each Other 241
Examples of Simple Trading Systems Using MA Crossovers 242
Welcome to Back Testing 244
Oscillators 244
How They're Used to Generate Buy/Sell Signals 246
When to Use Oscillators 248
Other Oscillators to Consider 248
Designer Genes 249
Moving Average Layering Indicates Trend Strength 249
The Stronger the Trend, the Clearer the MA Layering 249
CHAPTER 9 Technical Analysis: Future Study 255
Catch a Wave: Timing or Cycle Indicators 255
Meet the Fibonaccis 256
. . . And the Ganns 256
Catch the Most Popular Wave: Elliott Wave Theory and More 256
Combining Technical Indicators: Which Ones and How Many? 257
Your Tool Kit Needs a Gang of Four 258
Apply Indicators to Each Time Frame When Screening Trades 259
Back Testing: Learning from the Past 260
Back Testing Software: Play It Again, Sam 260
A Manual Back Testing Example 261
Back Testing Is a Tool, Not a Solution 265
Intermarket Analysis: Reading Intermarket Correlations and Divergences 265
Background 266
Currencies versus Equities: The S&P 500 as Forex Indicator 267
Risk Currencies versus Safe Haven Currencies 268
Why These Relationships Matter 268
They Give You a Fast, Big Picture 269
Divergences from Normal Correlations Can Be Significant 269
The USD versus Equities 271
The USD and Stocks: Correlation, but Not Causation 272
Currencies versus Currencies: How They Correlate 273
Warning: The U.S. Dollar Index Isn't a Substitute for Studying Charts 275
Currencies versus Commodities 277
Gold as a Barometer of the USD or EUR 277
Other Currency versus Commodity Correlations 282
Thinking Like a Pro, One Step Beyond Technical Analysis 284
Mind Games 284
Learn to Think Like These Pros 285
CHAPTER 10 Alternatives to Traditional Methods 287
Auto-Trading Systems: Welcome to the Machine 287
Currency Funds: Forex ETFs, ETNs, and More 289
Managed Accounts: Should You Seek Professional Help? 291
CHAPTER 11 Newer, Smarter Methods 295
Follow the Leaders: Forex Social Networks and Trading 295
What Are Forex Social Networks? 296
What Is Social Trading? 297
How It Works: The Highest Form of Flattery 297
Risks of Social Trading 298
Rewards of Social Trading 305
The Growth of Social Trading 307
How eToro and Currensee Compare 307
Great Tool, but Requires Skill to Use 311
An Auspicious Start 312
Do Your Homework Before You Decide Which to Use 312
Consider Market Conditions in Choosing Strategy and Risk Tolerance 313
Binary Options: Trading Made Easier 316
Background 318
How They Work 319
Pros and Cons 320
CHAPTER 12 Forex for Income: The Smartest Oxymoron 323
Ride Long-Term Forex Trends for Lower Risk, Higher Income 324
Why Income Investors Neglect Currency Diversification 325
Long-Term Trends for Long-Term Investors 327
Case Study: Canada 2000-2011: Applying Forex Trends to Equities Investing
328
The USD versus the CAD: Guess Which Has No Debt/GDP Problem 328
Equities: Canada Is Not Japan 329
Be Aware of Tax Withholdings and Credits 332
For Further Investigation: Online Resources 332
The Carry Trade: Using Direct Forex Trades as an Income Vehicle 333
Differences between Forex Carry Trade and Traditional Long-Term
Buy-and-Hold Instruments 334
The Key to Carry Trading 336
Carry Trade Steps 338
CHAPTER 13 Now What? Next Steps 341
Where You've Been 341
Where You're Going 342
APPENDIX A Recommended Free Online
Resources 347
Forex Sites 347
Thesensibleguidetoforex.com 347
BabyPips.com 347
DailyForex.com 348
DailyFX.com 348
Forex.com 349
ForexCrunch.com 350
ForexFactory.com 350
ForexMagnates.com 350
Forexpros.com 350
FXstreet.com 350
Bkassetmanagement.com 351
Other Favorite Financial Sites 351
BusinessInsider.com 351
Investopedia.com 351
SeekingAlpha.com 352
Wall Street Sector Selector (wallstreetsectorselector.com) 353
Individual Analysts 353
Fundamental Analysis 353
Technical Analysis 354
APPENDIX B How to Calculate Pip Values and Examples 355
Definition 355
Calculation 355
Example: EURUSD 356
Handy Rule of Tens 357
Example USDCAD 357
Example USDJPY: Rule of Tens Doesn't Apply with the JPY 358
APPENDIX C Forex Trading Time Zones, Liquidity, and Why These Matter 359
Three Major Trading Sessions and Why They Matter 359
Markets Tend to Follow Each Other 362
What Stops the Follow-Through? 363
1. News or How It's Interpreted 363
2. Technical Resistance: The News Is Already Priced In 363
The Prior Session Is Most Influential 363
Beware Holiday Catch-Up Sessions 364
APPENDIX D More on Leverage and Margin 365
APPENDIX E How the Mathematics of Loss Demands Keeping Losses Per Trade Low
367
APPENDIX F Choosing a Forex Broker 371
Suggested Search Terms to Find Broker Reviews 371
Criteria to Consider 371
APPENDIX G Low Correlations to Other Markets via Social Trading Means
There's Always a Bull Market Somewhere 375
Trade Leader Noncorrelations to the Markets 376
Market Correlations 376
Looking at the Trade Leaders 377
Diversification of Approach 378
Notes 379
About the Author 385
Index 387