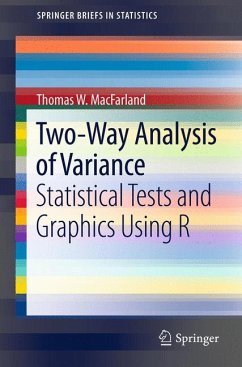
In statistics, analysis of variance (ANOVA) is a collection of statistical models used to distinguish between an observed variance in a particular variable and its component parts. In its simplest form, ANOVA provides a statistical test of whether or not the means of several groups are all equal, and therefore generalizes a test between these groups. One test often used by statisticians and researchers in their work is the Two-Way ANOVA, which determines the differences--and possible interactions--when variables are presented from the perspective of two or more categories. When a Two-Way ANOVA is implemented, it enables one to compare and contrast variables resulting from independent or joint actions. This brief provides guidance on how R can be used to facilitate Two-Way ANOVA for data analysis and graphical presentation. Along with instruction on the use of R and R syntax associated with Two-Way ANOVA, this brief will also reinforce the use of descriptive statistics and graphical figures to complement outcomes from parametric Two-Way ANOVA.
Dieser Download kann aus rechtlichen Gründen nur mit Rechnungsadresse in A, B, BG, CY, CZ, D, DK, EW, E, FIN, F, GR, HR, H, IRL, I, LT, L, LR, M, NL, PL, P, R, S, SLO, SK ausgeliefert werden.

