Kicab Castaneda-Mendez
Understanding Statistics and Statistical Myths (eBook, PDF)
How to Become a Profound Learner
80,95 €
80,95 €
inkl. MwSt.
Sofort per Download lieferbar

40 °P sammeln
80,95 €
Als Download kaufen

80,95 €
inkl. MwSt.
Sofort per Download lieferbar

40 °P sammeln
Jetzt verschenken
Alle Infos zum eBook verschenken
80,95 €
inkl. MwSt.
Sofort per Download lieferbar
Alle Infos zum eBook verschenken

40 °P sammeln
Kicab Castaneda-Mendez
Understanding Statistics and Statistical Myths (eBook, PDF)
How to Become a Profound Learner
- Format: PDF
- Merkliste
- Auf die Merkliste
- Bewerten Bewerten
- Teilen
- Produkt teilen
- Produkterinnerung
- Produkterinnerung

Bitte loggen Sie sich zunächst in Ihr Kundenkonto ein oder registrieren Sie sich bei
bücher.de, um das eBook-Abo tolino select nutzen zu können.
Hier können Sie sich einloggen
Hier können Sie sich einloggen
Sie sind bereits eingeloggt. Klicken Sie auf 2. tolino select Abo, um fortzufahren.

Bitte loggen Sie sich zunächst in Ihr Kundenkonto ein oder registrieren Sie sich bei bücher.de, um das eBook-Abo tolino select nutzen zu können.
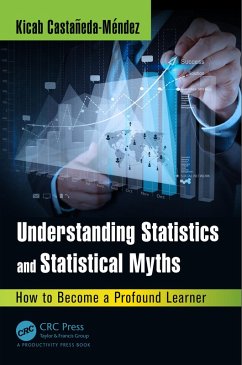
Addressing 30 statistical myths, this book explains how to understand statistics rather than how to do statistics. In the book, six characters discuss various topics including data, estimation, measurement system analysis, capability, hypothesis testing, statistical inference, and control charts taught in a fictional course that teaches students how to apply statistics to improve processes. Readers follow along and learn as the students apply what they learn to a project in which they are team members.
- Geräte: PC
- mit Kopierschutz
- eBook Hilfe
- Größe: 6.29MB
Andere Kunden interessierten sich auch für
![Introduction to Statistical Process Control (eBook, PDF) Introduction to Statistical Process Control (eBook, PDF)]() Peihua QiuIntroduction to Statistical Process Control (eBook, PDF)114,95 €
Peihua QiuIntroduction to Statistical Process Control (eBook, PDF)114,95 €![Quality Engineering Techniques (eBook, PDF) Quality Engineering Techniques (eBook, PDF)]() Ramin RostamkhaniQuality Engineering Techniques (eBook, PDF)47,95 €
Ramin RostamkhaniQuality Engineering Techniques (eBook, PDF)47,95 €![Simple (eBook, PDF) Simple (eBook, PDF)]() Barry L. CrossSimple (eBook, PDF)38,95 €
Barry L. CrossSimple (eBook, PDF)38,95 €![Basics of Supply Chain Management (eBook, PDF) Basics of Supply Chain Management (eBook, PDF)]() Jayanta Kumar BandyopadhyayBasics of Supply Chain Management (eBook, PDF)186,95 €
Jayanta Kumar BandyopadhyayBasics of Supply Chain Management (eBook, PDF)186,95 €![Project Management in the Fast Lane (eBook, PDF) Project Management in the Fast Lane (eBook, PDF)]() Robert C. NewboldProject Management in the Fast Lane (eBook, PDF)71,95 €
Robert C. NewboldProject Management in the Fast Lane (eBook, PDF)71,95 €![Manufacturing Cost Policy Deployment (MCPD) and Methods Design Concept (MDC) (eBook, PDF) Manufacturing Cost Policy Deployment (MCPD) and Methods Design Concept (MDC) (eBook, PDF)]() Alin PosteucaManufacturing Cost Policy Deployment (MCPD) and Methods Design Concept (MDC) (eBook, PDF)64,95 €
Alin PosteucaManufacturing Cost Policy Deployment (MCPD) and Methods Design Concept (MDC) (eBook, PDF)64,95 €![Disassembly Modeling for Assembly, Maintenance, Reuse and Recycling (eBook, PDF) Disassembly Modeling for Assembly, Maintenance, Reuse and Recycling (eBook, PDF)]() A. J. D. Lambert (Fred)Disassembly Modeling for Assembly, Maintenance, Reuse and Recycling (eBook, PDF)140,95 €
A. J. D. Lambert (Fred)Disassembly Modeling for Assembly, Maintenance, Reuse and Recycling (eBook, PDF)140,95 €-
-
-
Addressing 30 statistical myths, this book explains how to understand statistics rather than how to do statistics. In the book, six characters discuss various topics including data, estimation, measurement system analysis, capability, hypothesis testing, statistical inference, and control charts taught in a fictional course that teaches students how to apply statistics to improve processes. Readers follow along and learn as the students apply what they learn to a project in which they are team members.
Dieser Download kann aus rechtlichen Gründen nur mit Rechnungsadresse in A, B, BG, CY, CZ, D, DK, EW, E, FIN, F, GR, HR, H, IRL, I, LT, L, LR, M, NL, PL, P, R, S, SLO, SK ausgeliefert werden.
Produktdetails
- Produktdetails
- Verlag: Taylor & Francis eBooks
- Seitenzahl: 585
- Erscheinungstermin: 18. November 2015
- Englisch
- ISBN-13: 9781498727464
- Artikelnr.: 44203690
- Verlag: Taylor & Francis eBooks
- Seitenzahl: 585
- Erscheinungstermin: 18. November 2015
- Englisch
- ISBN-13: 9781498727464
- Artikelnr.: 44203690
- Herstellerkennzeichnung Die Herstellerinformationen sind derzeit nicht verfügbar.
Kicab Castaneda-Mendez, founder of Process Excellence Consultants, Chapel Hill, NC, provides consulting and training on operational excellence using lean Six Sigma methodologies, balanced scorecard and Baldrige framework.
Myth 1: Two Types of Data-Attribute/Discrete and Measurement/Continuous. Myth 2: Proportions and Percentages Are Discrete Data. Myth 3: s =
[
(Xi- x)2/(n- 1)] The Correct Formula for Sample Standard Deviation. Myth 4: Sample Standard Deviation
[
(Xi-x)2/(n- 1)] Is Unbiased. Myth 5: Variances Can Be Added but Not Standard Deviations. Myth 6: Parts and Operators for an MSA Do Not Have to Be Randomly Selected. Myth 7: % Study (% Contribution, Number of Distinct Categories) Is the Best Criterion for Evaluating a Measurement System for Process Improvement. Myth 8: Only Sigma Can Compare Different Processes and Metrics. Myth 9: Capability Is Not Percent/Proportion of Good Units. Myth 10: p = Probability of Making an Error. Myth 11: Need More Data for Discrete Data than Continuous Data Analysis. Myth 12: Nonparametric Tests Are Less Powerful than Parametric Tests. Myth 13: Sample Size of 30 Is Acceptable (for Statistical Significance). Myth 14: Can Only Fail to Reject Ho, Can Never Accept Ho. Myth 15: Control Limits Are ±3 Standard Deviations from the Center Line. Myth 16: Control Chart Limits Are Empirical Limits. Myth 17: Control Chart Limits Are Not Probability Limits. Myth 18: ±3 Sigma Limits Are the Most Economical Control Chart Limits. Myth 19: Statistical Inferences Are Inductive Inferences. Myth 20: There Is One Universe or Population If Data Are Homogeneous. Myth 21: Control Charts Are Analytic Studies. Myth 22: Control Charts Are Not Tests of Hypotheses. Myth 23: Process Needs to Be Stable to Calculate Process Capability. Myth 24: Specifications Don't Belong on Control Charts. Myth 25: Identify and Eliminate Assignable or Assignable Causes of Variation. Myth 26: Process Needs to Be Stable before You Can Improve It. Myth 27: Stability (Homogeneity) Is Required to Establish a Baseline? Myth 28: A Process Must Be Stable to Be Predictable. Myth 29: Adjusting a Process Based on a Single Defect Is Tampering, Causing Increased Process Variation. Myth 30: No Assumptions Required When the Data Speak for Themselves.
[
(Xi- x)2/(n- 1)] The Correct Formula for Sample Standard Deviation. Myth 4: Sample Standard Deviation
[
(Xi-x)2/(n- 1)] Is Unbiased. Myth 5: Variances Can Be Added but Not Standard Deviations. Myth 6: Parts and Operators for an MSA Do Not Have to Be Randomly Selected. Myth 7: % Study (% Contribution, Number of Distinct Categories) Is the Best Criterion for Evaluating a Measurement System for Process Improvement. Myth 8: Only Sigma Can Compare Different Processes and Metrics. Myth 9: Capability Is Not Percent/Proportion of Good Units. Myth 10: p = Probability of Making an Error. Myth 11: Need More Data for Discrete Data than Continuous Data Analysis. Myth 12: Nonparametric Tests Are Less Powerful than Parametric Tests. Myth 13: Sample Size of 30 Is Acceptable (for Statistical Significance). Myth 14: Can Only Fail to Reject Ho, Can Never Accept Ho. Myth 15: Control Limits Are ±3 Standard Deviations from the Center Line. Myth 16: Control Chart Limits Are Empirical Limits. Myth 17: Control Chart Limits Are Not Probability Limits. Myth 18: ±3 Sigma Limits Are the Most Economical Control Chart Limits. Myth 19: Statistical Inferences Are Inductive Inferences. Myth 20: There Is One Universe or Population If Data Are Homogeneous. Myth 21: Control Charts Are Analytic Studies. Myth 22: Control Charts Are Not Tests of Hypotheses. Myth 23: Process Needs to Be Stable to Calculate Process Capability. Myth 24: Specifications Don't Belong on Control Charts. Myth 25: Identify and Eliminate Assignable or Assignable Causes of Variation. Myth 26: Process Needs to Be Stable before You Can Improve It. Myth 27: Stability (Homogeneity) Is Required to Establish a Baseline? Myth 28: A Process Must Be Stable to Be Predictable. Myth 29: Adjusting a Process Based on a Single Defect Is Tampering, Causing Increased Process Variation. Myth 30: No Assumptions Required When the Data Speak for Themselves.
