Visual Analytics with Tableau (eBook, PDF)

PAYBACK Punkte
0 °P sammeln!
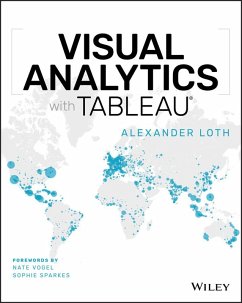
A four-color journey through a complete Tableau visualizationTableau is a popular data visualization tool that's easy for individual desktop use as well as enterprise. Used by financial analysts, marketers, statisticians, business and sales leadership, and many other job roles to present data visually for easy understanding, it's no surprise that Tableau is an essential tool in our data-driven economy.Visual Analytics with Tableau is a complete journey in Tableau visualization for a non-technical business user. You can start from zero, connect your first data, and get right into creating and p...
A four-color journey through a complete Tableau visualization
Tableau is a popular data visualization tool that's easy for individual desktop use as well as enterprise. Used by financial analysts, marketers, statisticians, business and sales leadership, and many other job roles to present data visually for easy understanding, it's no surprise that Tableau is an essential tool in our data-driven economy.
Visual Analytics with Tableau is a complete journey in Tableau visualization for a non-technical business user. You can start from zero, connect your first data, and get right into creating and publishing awesome visualizations and insightful dashboards.
. Learn the different types of charts you can create
. Use aggregation, calculated fields, and parameters
. Create insightful maps
. Share interactive dashboards
Geared toward beginners looking to get their feet wet with Tableau, this book makes it easy and approachable to get started right away.
Dieser Download kann aus rechtlichen Gründen nur mit Rechnungsadresse in D ausgeliefert werden.


