51,95 €
51,95 €
inkl. MwSt.
Sofort per Download lieferbar
payback
26 °P sammeln
51,95 €
51,95 €
inkl. MwSt.
Sofort per Download lieferbar

Alle Infos zum eBook verschenken
payback
26 °P sammeln
Als Download kaufen
51,95 €
inkl. MwSt.
Sofort per Download lieferbar
payback
26 °P sammeln
Jetzt verschenken
51,95 €
inkl. MwSt.
Sofort per Download lieferbar

Alle Infos zum eBook verschenken
payback
26 °P sammeln
  • Format: PDF

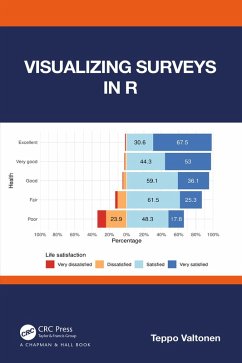
For researchers who use surveys interested in learning how to seize vast possibilities and flexibility of R in survey analysis/visualizations. Psychologists, marketeers, HR personnel, managers, other professionals who wish to standardize/automate the process for visualizing survey data. Suitable for textbook courses.

Produktbeschreibung
For researchers who use surveys interested in learning how to seize vast possibilities and flexibility of R in survey analysis/visualizations. Psychologists, marketeers, HR personnel, managers, other professionals who wish to standardize/automate the process for visualizing survey data. Suitable for textbook courses.

Dieser Download kann aus rechtlichen Gründen nur mit Rechnungsadresse in A, B, BG, CY, CZ, D, DK, EW, E, FIN, F, GR, HR, H, IRL, I, LT, L, LR, M, NL, PL, P, R, S, SLO, SK ausgeliefert werden.

Autorenporträt
Teppo Valtonen has worked for more than a decade at the Finnish Institute of Occupational on assessing and improving cognitive ergonomics in dozens of organizations of all sizes and from many different industries. His responsibility is to develop and standardize the processes and practices regarding survey implementation and survey data management.

Teppo has graduated as a Master of Science in Technology from the Helsinki University of Tehchnology, today part of the Aalto University, Helsinki, Finland. He is currently a doctoral student at the Aalto University doing research on cognitive demands, productivity and performance at work.

Teppo builds and uses surveys in both research and commercial settings. He has designed questions, scales, surveys and survey forms for research projects, development studies and customer cases. The surveys have produced thousands of observations for hundreds of variables on topics such as cognitive strain, stress, recovery, work engagement, productivity and performance. Typically, Teppo has been responsible for specifying the variables and datasets, managing survey versions, saving the data, validating data and combining data from different survey versions.

Using R, he has created data visualizations for academic and popular reports alike. He has used R to build automatic analysis pipelines and processes for survey data. He has taught R and given advice on using R in various data analysis and management setups.