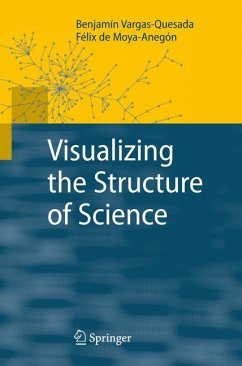
Vargas-Quesada and Moya-Anegón propose a methodology for visualizing large scientific domains. They create science maps, so-called "scientograms", based on the interactions between authors and their papers through citations and co-citations, using approaches such as domain analysis, social networks, cluster analysis and pathfinder networks. The resulting scientograms offer manifold possibilities. Domain analysts can discover the most significant connections between categories of a given domain, and they can also see how these categories are grouped into major thematic areas and how they are interrelated through a logical internal, while information scientists or researchers new to an area may appreciate a durable image of the essential structure of a domain.
Dieser Download kann aus rechtlichen Gründen nur mit Rechnungsadresse in A, B, BG, CY, CZ, D, DK, EW, E, FIN, F, GR, HR, H, IRL, I, LT, L, LR, M, NL, PL, P, R, S, SLO, SK ausgeliefert werden.
"Numerous aspects of the book are unequivocally so new ... . Just about anyone involved in Information Technology and Documentation Sciences will be fascinated by this new approach ... . The well-stocked Bibliography will permit novices an easy entry into this new research field ... . The book's excellent overview of a difficult subject matter is highly recommended to experts. ... the philosophy, methodology, technology, science and pedagogy presented are unique and important! To the authors: congratulations!" (Karl H. Wolf, International Journal of General Systems, 2008)

