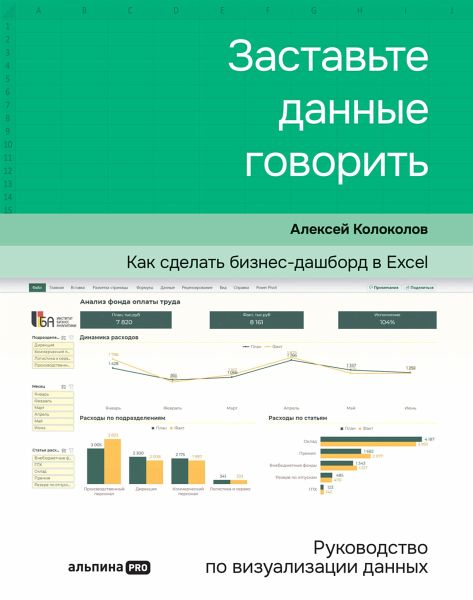
Zastav'te dannye govorit': Kak sdelat' biznes-dashbord v Excel. Rukovodstvo po vizualizacii dannyh (eBook, ePUB)
Sofort per Download lieferbar
18,99 €
inkl. MwSt.

PAYBACK Punkte
0 °P sammeln!
Collecting disparate data for a report and presenting it visually is not an easy task for a customer. Aleksey Kolokolov, who has been teaching data analysis and visualization since 2015, is well aware of this. He wrote a detailed guide to creating dashboards and devoted most of it to practice. Kolokolov consistently analyzes the process of compiling a report, starting with data preparation and ending with corporate identity design. Using real examples, he describes what needs to be done at each stage, and accompanies the story with detailed illustrations. The reader will be able to build a fun...
Collecting disparate data for a report and presenting it visually is not an easy task for a customer. Aleksey Kolokolov, who has been teaching data analysis and visualization since 2015, is well aware of this. He wrote a detailed guide to creating dashboards and devoted most of it to practice. Kolokolov consistently analyzes the process of compiling a report, starting with data preparation and ending with corporate identity design. Using real examples, he describes what needs to be done at each stage, and accompanies the story with detailed illustrations. The reader will be able to build a functional dashboard from scratch without even having Excel skills. Aleksey Kolokolov explains how to pre-work with the data so that the dashboard is updated automatically, how to arrange information blocks on the layout and design elements to make the report look professional and expensive. The reader will learn which charts are best used for different types of data, understand the principles of setting them up, and get acquainted with visualization techniques that can be used in Excel, PowerPoint, Power BI, Tableau, or Russian BI systems.
Dieser Download kann aus rechtlichen Gründen nur mit Rechnungsadresse in A, B, BG, CY, CZ, D, DK, EW, E, FIN, F, GR, H, IRL, I, LT, L, LR, M, NL, PL, P, R, S, SLO, SK ausgeliefert werden.


