Jane Forrest, Paula Waldman, Jennifer Chang Wathall, Suzanne Doering, David Harris, Nadia Stoyanova Kennedy
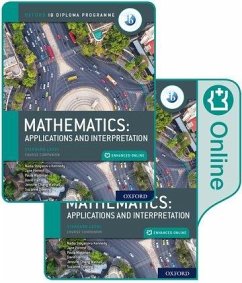
Oxford IB Diploma Programme: IB Mathematics: applications and interpretation
Jane Forrest, Paula Waldman, Jennifer Chang Wathall, Suzanne Doering, David Harris, Nadia Stoyanova Kennedy
Oxford IB Diploma Programme: IB Mathematics: applications and interpretation
- Broschiertes Buch
- Merkliste
- Auf die Merkliste
- Bewerten Bewerten
- Teilen
- Produkt teilen
- Produkterinnerung
- Produkterinnerung
Featuring a wealth of digital content, this concept-based Print and Enhanced Online Course Book Pack has been developed in cooperation with the IB to provide the most comprehensive support for the new DP Mathematics: applications and interpretation SL syllabus, for first teaching in September 2019.
Andere Kunden interessierten sich auch für
![Oxford IB Diploma Programme: IB Mathematics: applications and interpretation, Higher Level, Print and Enhanced Online Course Book Pack Oxford IB Diploma Programme: IB Mathematics: applications and interpretation, Higher Level, Print and Enhanced Online Course Book Pack]() Tony HalseyOxford IB Diploma Programme: IB Mathematics: applications and interpretation, Higher Level, Print and Enhanced Online Course Book Pack78,99 €
Tony HalseyOxford IB Diploma Programme: IB Mathematics: applications and interpretation, Higher Level, Print and Enhanced Online Course Book Pack78,99 €![Oxford IB Diploma Programme: IB Mathematics: analysis and approaches Oxford IB Diploma Programme: IB Mathematics: analysis and approaches]() Marlene Torres SkoumalOxford IB Diploma Programme: IB Mathematics: analysis and approaches78,99 €
Marlene Torres SkoumalOxford IB Diploma Programme: IB Mathematics: analysis and approaches78,99 €![Oxford IB Diploma Programme: IB Mathematics: analysis and approaches Oxford IB Diploma Programme: IB Mathematics: analysis and approaches]() Paul La RondieOxford IB Diploma Programme: IB Mathematics: analysis and approaches78,99 €
Paul La RondieOxford IB Diploma Programme: IB Mathematics: analysis and approaches78,99 €![Oxford IB Diploma Programme: IB Theory of Knowledge Course Book Oxford IB Diploma Programme: IB Theory of Knowledge Course Book]() Marija Uzunova DangOxford IB Diploma Programme: IB Theory of Knowledge Course Book48,99 €
Marija Uzunova DangOxford IB Diploma Programme: IB Theory of Knowledge Course Book48,99 €![Oxford IB Diploma Programme: IB Prepared: Geography Oxford IB Diploma Programme: IB Prepared: Geography]() Garrett NagleOxford IB Diploma Programme: IB Prepared: Geography35,99 €
Garrett NagleOxford IB Diploma Programme: IB Prepared: Geography35,99 €![Oxford IB Diploma Programme - Theorie of Knowledge Oxford IB Diploma Programme - Theorie of Knowledge]() Marija UzunovaOxford IB Diploma Programme - Theorie of Knowledge61,99 €
Marija UzunovaOxford IB Diploma Programme - Theorie of Knowledge61,99 €![Oxford IB Diploma Programme: IB Economics Course Book Oxford IB Diploma Programme: IB Economics Course Book]() Jocelyn BlinkOxford IB Diploma Programme: IB Economics Course Book52,99 €
Jocelyn BlinkOxford IB Diploma Programme: IB Economics Course Book52,99 €-
-
-
Featuring a wealth of digital content, this concept-based Print and Enhanced Online Course Book Pack has been developed in cooperation with the IB to provide the most comprehensive support for the new DP Mathematics: applications and interpretation SL syllabus, for first teaching in September 2019.
Hinweis: Dieser Artikel kann nur an eine deutsche Lieferadresse ausgeliefert werden.
Hinweis: Dieser Artikel kann nur an eine deutsche Lieferadresse ausgeliefert werden.
Produktdetails
- Produktdetails
- Verlag: Oxford Children's Books
- Erscheinungstermin: 21. Februar 2019
- Englisch
- Abmessung: 252mm x 193mm x 28mm
- Gewicht: 1410g
- ISBN-13: 9780198426981
- ISBN-10: 0198426984
- Artikelnr.: 55565457
- Herstellerkennzeichnung
- Libri GmbH
- Europaallee 1
- 36244 Bad Hersfeld
- gpsr@libri.de
- Verlag: Oxford Children's Books
- Erscheinungstermin: 21. Februar 2019
- Englisch
- Abmessung: 252mm x 193mm x 28mm
- Gewicht: 1410g
- ISBN-13: 9780198426981
- ISBN-10: 0198426984
- Artikelnr.: 55565457
- Herstellerkennzeichnung
- Libri GmbH
- Europaallee 1
- 36244 Bad Hersfeld
- gpsr@libri.de
Jane Forrest, Paula Waldman, Jennifer Chang Wathall, Suzanne Doering, David Harris, Nadia Stoyanova Kennedy
* Measuring space: accuracy and 2D geometry
* 1.1: Measurements and estimates
* 1.2: Recording measurements, significant digits and rounding
* 1.3: Measurements: exact or approximate?
* 1.4: Speaking scientifically
* 1.5: Trigonometry of right-angled triangles and indirect measurements
* 1.6: Angles of elevation and depression
* Representing space: non-right angled trigonometry and volumes
* 2.1: Trigonometry of non-right triangles
* 2.2: Area of triangle formula. Applications of right and non-right
angled trigonometry
* 2.3: Geometry: solids, surface area and volume
* Representing and describing data: descriptive statistics
* 3.1: Collecting and organising univariate data
* 3.2: Sampling techniques
* 3.3: Presentation of data
* 3.4: Bivariate data
* Dividing up space: coordinate geometry, lines, Voronoi diagrams
* 4.1: Coordinates, distance and midpoint formula in 2D and 3D
* 4.2: Gradient of lines and its applications
* 4.3: Equations of straight lines; different forms of equations
* 4.4: Parallel and perpendicular lines
* 4.5: Voronoi diagrams and toxic waste problem
* Modelling constant rates of change: linear functions
* 5.1: Functions
* 5.2: Linear Models
* 5.3: Arithmetic Sequences
* 5.4: Modelling
* Modelling relationships: linear correlation of bivariate data
* 6.1: Measuring correlation
* 6.2: The line of best fit
* 6.3: Interpreting the regression line
* Quantifying uncertainty: probability, binomial and normal
distributions
* 7.1: Theoretical and experimental probability
* 7.2: Representing combined probabilities with diagrams
* 7.3: Representing combined probabilities with diagrams and formulae
* 7.4: Complete, concise and consistent representations
* 7.5: Modelling random behaviour: random variables and probability
distributions
* 7.6: Modelling the number of successes in a fixed number of trials
* 7.7: Modelling measurements that are distributed randomly
* Testing for validity: Spearman's, hypothesis testing and x^2 test for
independence
* 8.1: Spearman's rank correlation coefficient
* 8.2: chi^2 test for independence
* 8.3: chi^2 goodness of fit test
* 8.4: The t-test
* Modelling relationships with functions: power functions
* 9.1: Quadratic models
* 9.2: Problems involving quadratics
* 9.3: Cubic models, power functions and direct and inverse variation
* 9.4: Optimisation
* Modelling rates of change: exponential and logarithmic functions
* 10.1: Geometric sequences and series
* 10.2: Compound interest, annuities, amortization
* 10.3: Exponential models
* 10.4: Exponential equations and logarithms
* Modelling periodic phenomena: trigonometric functions
* 11.1: An introduction to periodic functions
* 11.2: An infinity of sinusoidal functions
* 11.3: A world of sinusoidal models
* Analyzing rates of change: differential calculus
* 12.1: Limits and derivatives
* 12.2: Equation of tangent and normal and increasing and decreasing
functions
* 12.3: Maximum and minimum points and optimisation
* Approximating irregular spaces: integration
* 13.1: Finding areas
* 13.2: Integration: the reverse processes of differentiation
* Exploration

