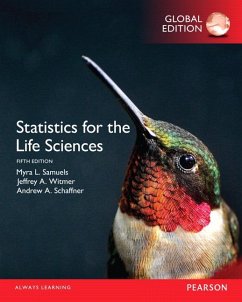
For introductory undergraduate or graduate courses in statistics aimed at life science majors.
Bringing Statistics to Life
The Fifth Edition of Statistics for the Life Sciences uses authentic examples and exercises from a wide variety of life science domains to give statistical concepts personal relevance, enabling students to connect concepts with situations they will encounter outside the classroom. The emphasis on understanding ideas rather than memorizing formulas makes the text ideal for students studying a variety of scientific fields: animal science, agronomy, biology, forestry, health, medicine, nutrition, pharmacy, physical education, zoology and more. In the fifth edition, randomization tests have been moved to the fore to motivate the inference procedures introduced in the text. There are no prerequisites for the text except elementary algebra.
Features + Benefits
Content and Approach
Real data in the examples and exercises provide practical and relevant ways for students to connect concepts to situations they will encounter outside the classroom.
Probability theory is included only to support statistics concepts.
Students are taught to recognize the importance of an analysis that is appropriate for the research question to be answered, for the statistical design of the study, and for the nature of the underlying distributions.
Students are led to recognize the impact on real research of design concepts such as random sampling, randomization, efficiency, and the control of extraneous variation by blocking or adjustment.
The text concludes with a summary of all of the inference methods presented in the book and provides exercises that require students to apply all of what they have learned.
NEW! Randomization methods have been added at the beginnings of Chapters 7, 8, 10, 11, and 12 to introduce or motivate most inference procedures in the text.
Structured to Foster Success
Exercises are designed to focus students’ attention on concepts and interpretations rather than on computation.
While statistical software is not required to use this text, there are ample opportunities for students to implement the statistical methods learned using any statistical software package of their choosing. Electronic data files are provided for most examples and exercises.
NEW! Unit Highlights provide a chance for students to connect ideas across multiple chapters. They include reflections, summaries, additional examples, and exercises.
UNIT I: DATA AND DISTRIBUTIONS
1. Introduction
1.1 Statistics and the Life Sciences
1.2 Types of Evidence
1.3 Random Sampling
2. Description of Samples and Populations
2.1 Introduction
2.2 Frequency Distributions
2.3 Descriptive Statistics: Measures of Center
2.4 Boxplots
2.5 Relationships Between Variables
2.6 Measures of Dispersion
2.7 Effect of Transformation of Variables
2.8 Statistical Inference
2.9 Perspective
3. Probability and the Binomial Distribution
3.1 Probability and the Life Sciences
3.2 Introduction to Probability
3.3 Probability Rules (Optional)
3.4 Density Curves
3.5 Random Variables
3.6 The Binomial Distribution
3.7 Fitting a Binomial Distribution to Data (Optional)
4. The Normal Distribution
4.1 Introduction
4.2 The Normal Curves
4.3 Areas under a Normal Curve
4.4 Assessing Normality
4.5 Perspective
5. Sampling Distributions
5.1 Basic Ideas
5.2 The Sample Mean
5.3 Illustration of the Central Limit Theorem
5.4 The Normal Approximation to the Binomial Distribution
5.5 Perspective
Unit I Highlights and Study
UNIT II: INFERENCE FOR MEANS
6. Confidence Intervals
6.1 Statistical Estimation
6.2 Standard Error of the Mean
6.3 Confidence Interval for μ
6.4 Planning a Study to Estimate μ
6.5 Conditions for Validity of Estimation Methods
6.6 Comparing Two Means
6.7 Confidence Interval for (μ1 - μ2)
6.8 Perspective and Summary
7. Comparison of Two Independent Samples
7.1 Hypothesis Testing: The Randomization Test
7.2 Hypothesis Testing: The t Test
7.3 Further Discussion of the t Test
7.4 Association and Causation
7.5 One-Tailed t Tests
7.6 More on Interpretation of Statistical Significance
7.7 Planning for Adequate Power
7.8 Student’s t: Conditions and Summary
7.9 More on Principles of Testing Hypotheses
7.10 The Wilcoxon-Mann-Whitney Test
8. Comparison of Paired Samples
8.1 Introduction
8.2 The Paired-Sample t Test and Confidence Interval
8.3 The Paired Design
8.4 The Sign Test
8.5 The Wilcoxon Signed-Rank Test
8.6 Perspective
Unit II Highlights and Study
UNIT III: INFERENCE FOR CATEGORICAL DATA
9. Categorical Data: One-Sample Distributions
9.1 Dichotomous Observations
9.2 Confidence Interval for a Population Proportion
9.3 Other Confidence Levels (Optional)
9.4 Inference for Proportions: The Chi-Square Goodness-of-Fit Test
9.5 Perspective and Summary
10. Categorical Data: Relationships
10.1 Introduction
10.2 The Chi-Square Test for the 2 × 2 Contingency Table
10.3 Independence and Association in the 2 × 2 Contingency Table
10.4 Fisher’s Exact Test
10.5 The r × k Contingency Table
10.6 Applicability of Methods
10.7 Confidence Interval for Difference Between Probabilities
10.8 Paired Data and 2 × 2 Tables
10.9 Relative Risk and the Odds Ratio
10.10 Summary of Chi-Square Test
Unit III Highlights and Study
UNIT IV: MODELING RELATIONSHIPS
11. Comparing the Means of Many Independent Samples
11.1 Introduction
11.2 The Basic One-Way Analysis of Variance
11.3 The Analysis of Variance Model
11.4 The Global F Test
11.5 Applicability of Methods
11.6 One-Way Randomized Blocks Design
11.7 Two-Way ANOVA
11.8 Linear Combinations of Means
11.9 Multiple Comparisons
11.10 Perspective
12. Linear Regression and Correlation
12.1 Introduction
12.2 The Correlation Coefficient
12.3 The Fitted Regression Line
12.4 Parametric Interpretation of Regression: The Linear Model
12.5 Statistical Inference Concerning β1
12.6 Guidelines for Interpreting Regression and Correlation
12.7 Precision in Prediction
12.8 Perspective
12.9 Summary of Formulas
Unit IV Highlights and Study
13. A Summary of Inference Methods
13.1 Introduction
13.2 Data Analysis Examples
Chapter Appendices
Chapter Notes
Statistical Tables
Answers to Selected Exercises
For introductory undergraduate or graduate courses in statistics aimed at life science majors. Bringing Statistics to Life The Fifth Edition of Statistics for the Life Sciences uses authentic examples and exercises from a wide variety of life science domains to give statistical concepts personal relevance, enabling students to connect concepts with situations they will encounter outside the classroom. The emphasis on understanding ideas rather than memorizing formulas makes the text ideal for students studying a variety of scientific fields: animal science, agronomy, biology, forestry, health, medicine, nutrition, pharmacy, physical education, zoology and more. In the fifth edition, randomization tests have been moved to the fore to motivate the inference procedures introduced in the text. There are no prerequisites for the text except elementary algebra.
Hinweis: Dieser Artikel kann nur an eine deutsche Lieferadresse ausgeliefert werden.

