Harvey Motulsky, Arthur Christopoulos
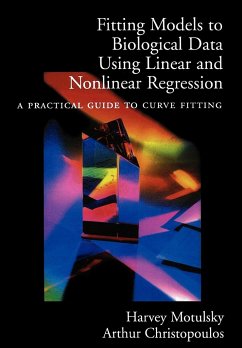
Fitting Models to Biological Data Using Linear and Nonlinear Regression
A Practical Guide to Curve Fitting
Harvey Motulsky, Arthur Christopoulos
Fitting Models to Biological Data Using Linear and Nonlinear Regression
A Practical Guide to Curve Fitting
- Broschiertes Buch
- Merkliste
- Auf die Merkliste
- Bewerten Bewerten
- Teilen
- Produkt teilen
- Produkterinnerung
- Produkterinnerung
Most biologists use nonlinear regression more than any other statistical technique, but there are very few places to learn about curve-fitting. This book, by the author of the very successful Intuitive Biostatistics, addresses this relavtively focused need of an extraordinarily broad range of scientists.
Andere Kunden interessierten sich auch für
![Linear Regression With Python: A Tutorial Introduction to the Mathematics of Regression Analysis Linear Regression With Python: A Tutorial Introduction to the Mathematics of Regression Analysis]() James V. StoneLinear Regression With Python: A Tutorial Introduction to the Mathematics of Regression Analysis28,99 €
James V. StoneLinear Regression With Python: A Tutorial Introduction to the Mathematics of Regression Analysis28,99 €![Stochastic Parameter Regression Models Stochastic Parameter Regression Models]() Paul NewboldStochastic Parameter Regression Models47,99 €
Paul NewboldStochastic Parameter Regression Models47,99 €![Advanced Regression Models with SAS and R Advanced Regression Models with SAS and R]() Olga KorostelevaAdvanced Regression Models with SAS and R71,99 €
Olga KorostelevaAdvanced Regression Models with SAS and R71,99 €![Logistic Regression Models for Ordinal Response Variables Logistic Regression Models for Ordinal Response Variables]() Ann A. O'ConnellLogistic Regression Models for Ordinal Response Variables47,99 €
Ann A. O'ConnellLogistic Regression Models for Ordinal Response Variables47,99 €![Circular and Linear Regression Circular and Linear Regression]() Nikolai ChernovCircular and Linear Regression74,99 €
Nikolai ChernovCircular and Linear Regression74,99 €![Seemingly Unrelated Regression Equations Models Seemingly Unrelated Regression Equations Models]() Virendera K. SrivastavaSeemingly Unrelated Regression Equations Models66,99 €
Virendera K. SrivastavaSeemingly Unrelated Regression Equations Models66,99 €![AP-Statistics: High School Math Tutor Lesson Plans: Experimental Design, Distributions, Linear & Nonlinear Bivariate Data, Randomness AP-Statistics: High School Math Tutor Lesson Plans: Experimental Design, Distributions, Linear & Nonlinear Bivariate Data, Randomness]() Iglobal Educational ServicesAP-Statistics: High School Math Tutor Lesson Plans: Experimental Design, Distributions, Linear & Nonlinear Bivariate Data, Randomness14,99 €
Iglobal Educational ServicesAP-Statistics: High School Math Tutor Lesson Plans: Experimental Design, Distributions, Linear & Nonlinear Bivariate Data, Randomness14,99 €-
-
-
Most biologists use nonlinear regression more than any other statistical technique, but there are very few places to learn about curve-fitting. This book, by the author of the very successful Intuitive Biostatistics, addresses this relavtively focused need of an extraordinarily broad range of scientists.
Hinweis: Dieser Artikel kann nur an eine deutsche Lieferadresse ausgeliefert werden.
Hinweis: Dieser Artikel kann nur an eine deutsche Lieferadresse ausgeliefert werden.
Produktdetails
- Produktdetails
- Verlag: Oxford University Press, USA
- Seitenzahl: 356
- Erscheinungstermin: 1. Dezember 2003
- Englisch
- Abmessung: 244mm x 170mm x 19mm
- Gewicht: 615g
- ISBN-13: 9780195171808
- ISBN-10: 0195171802
- Artikelnr.: 21758277
- Herstellerkennzeichnung
- Books on Demand GmbH
- In de Tarpen 42
- 22848 Norderstedt
- info@bod.de
- 040 53433511
(Professor in the Department of Pharmacology, University of Melbourne, Australia)
* Fitting data with nonlinear regression
* 1: An example of nonlinear regression
* 2: Preparing data for nonlinear regression
* 3: Nonlinear regression choices
* 4: The first five questions to ask about nonlinear regression results
* 5: The results of nonlinear regression
* 6: Troubleshooting "bad fits"
* Fitting data with linear regression
* 7: Choosing linear regression
* 8: Interpreting the results of linear regression
* Models
* 9: Introducing models
* 10: Tips on choosing a model
* 11: Global models
* 12: Compartmental models and defining a model with a differential
equation
* How nonlinear regression works
* 13: Modeling experimental error
* 14: Unequal weighting of data points
* 15: How nonlinear regression minimized the sum-of-squares
* Confidence intervals of the parameters
* 16: Asymptotic standard errors and confidence intervals
* 17: Generating confidence intervals by Monte Carlo simulations
* 18: Generating confidence intervals via model comparison
* 19: comparing the three methods for creating confidence intervals
* 20: Using simulations to understand confidence intervals and plan
experiments
* Comparing models
* 21: Approach to comparing models
* 22: Comparing models using the extra sum-of-squares F test
* 23: Comparing models using Akaike's Information Criterion
* 24: How should you compare modes-AICe or F test?
* 25: Examples of comparing the fit of two models to one data set
* 26: Testing whether a parameter differs from a hypothetical value
* How does a treatment change the curve?
* 27: Using global fitting to test a treatment effect in one experiment
* 28: Using two-way ANOVA to compare curves
* 29: Using a paired t test to test for a treatment effect in a series
of matched experiments
* 30: Using global fitting to test for a treatment effect in a series
of matched experiments
* 31: Using an unpaired t test to test for a treatment effect in a
series of unmatched experiments
* 32: Using global fitting to test for a treatment effect in a series
of unmatched experiments
* Fitting radioligand and enzyme kinetics data
* 33: The law of mass action
* 34: Analyzing radioligand binding data
* 35: Calculations with radioactivity
* 36: Analyzing saturation radioligand binding data
* 37: Analyzing competitive binding data
* 38: Homologous competitive binding curves
* 39: Analyzing kinetic binding data
* 40: Analyzing enzyme kinetic data
* Fitting does-response curves
* 41: Introduction to dose-response curves
* 42: The operational model of agonist action
* 43: Dose-response curves in the presence of antagonists
* 44: Complex dose-response curves
* Fitting curves with GraphPad Prism
* 45: Nonlinear regression with Prism
* 46: Constraining and sharing parameters
* 47: Prsim's nonlinear regression dialog
* 48: Classic nonlinear models built-in to Prism
* 49: Importing equations and equation libraries
* 50: Writing user-defined models in Prism
* 51: Linear regression with Prism
* 52: Reading unknowns from standard curves
* 53: Graphing a family of theoretical curves
* 54: Fitting curves without regression

