35,95 €
35,95 €
inkl. MwSt.
Sofort per Download lieferbar
35,95 €
35,95 €
inkl. MwSt.
Sofort per Download lieferbar

Alle Infos zum eBook verschenken
Als Download kaufen
35,95 €
inkl. MwSt.
Sofort per Download lieferbar
Jetzt verschenken
35,95 €
inkl. MwSt.
Sofort per Download lieferbar

Alle Infos zum eBook verschenken
  • Format: PDF

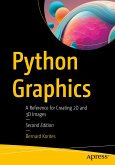
Use Python's built-in features to create innovative graphics for data visualization and technical illustrations. This book goes beyond simple commands and libraries to explain how to not only display but also rotate, shade, and edit graphics for any purpose. Starting with the essential Python functions to set up a plotting space and produce 2 and 3-dimensional objects, you'll learn how to construct more complex objects, translate and rotate them, remove hidden lines, introduce shading to add realism, and project images to visualize any dataset. The final chapter includes several worked…mehr

  • Geräte: PC
  • ohne Kopierschutz
  • eBook Hilfe
  • Größe: 10.49MB
Produktbeschreibung
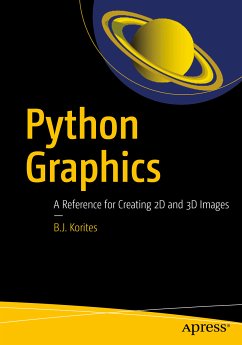
Use Python's built-in features to create innovative graphics for data visualization and technical illustrations. This book goes beyond simple commands and libraries to explain how to not only display but also rotate, shade, and edit graphics for any purpose.
Starting with the essential Python functions to set up a plotting space and produce 2 and 3-dimensional objects, you'll learn how to construct more complex objects, translate and rotate them, remove hidden lines, introduce shading to add realism, and project images to visualize any dataset. The final chapter includes several worked applications in science and engineering including planetary models, which you can adapt for your own use.
Written for developers who want to harness Python's capabilities to fine-tune their images, Python Graphics covers the different commands for plotting dots, lines, arrows, or arcs, creating custom plotting grids, correcting distortions, adding text and labels to illustrations, manipulating arcs and circles, specify and use colors, and more. Armed with these techniques and core math skills, you'll be ready to create and customize detailed technical illustrations or data visualizations.

Dieser Download kann aus rechtlichen Gründen nur mit Rechnungsadresse in A, B, BG, CY, CZ, D, DK, EW, E, FIN, F, GR, HR, H, IRL, I, LT, L, LR, M, NL, PL, P, R, S, SLO, SK ausgeliefert werden.
Autorenporträt
¿Dr. Bernard J. Korites has been involved in engineering and scientific applications of computers for his entire career. He has been an educator, consultant, and author of more than ten books on geometric modelling, computer graphics, artificial intelligence, simulation of physical processes, structural analysis and the application of computers in science and engineering.
He has been employed by Northrop Aviation, the Woods Hole Oceanographic Institute, Arthur D. Little, Itek and Worcester Polytech. He has consulted for Stone and Webster Engineering, Gould Inc, Wyman Gordon, CTI Cryogenics, the US Navy, Aberdeen Proving Grounds, and others. Early in his career he developed software to find physical interference between systems of solid objects and draw 3-dimensional and stereographic views. This found wide application in the design of power plants, submarines and other systems with densely packed spaces.