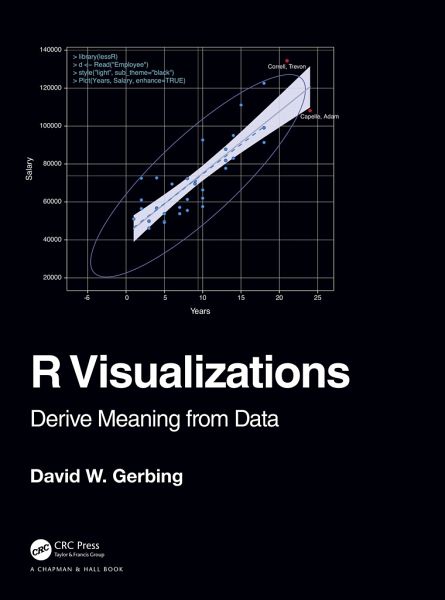
This book is focused on one of the two major topics of doing data analysis: data visualization, aka, computer graphics. In one place the major R systems for visualization are discussed, organized by topic and not by system. Anyone doing data analysis will be shown how to use R to generate basic visualizations with any of R visualization systems.
This book is focused on one of the two major topics of doing data analysis: data visualization, aka, computer graphics. In one place the major R systems for visualization are discussed, organized by topic and not by system. Anyone doing data analysis will be shown how to use R to generate basic visualizations with any of R visualization systems.Hinweis: Dieser Artikel kann nur an eine deutsche Lieferadresse ausgeliefert werden.
David W. Gerbing has a Quantitative Methods B.A. from Western Washington State College, and M.A. from Michigan State University, and a Ph.D. from Michigan State University. Dr. Gerbing teaches statistics, quantitative methods, and business research techniques. His research interests are in the areas of quantitative analysis, multivariate statistics, and behavioral measurement and assessment. Currently his primary interest is in the increasing the accessibility of the R programming language for data science so that non-programmers can access the free, open source data analysis system without a steep learning curve.
Inhaltsangabe
1. R, Data and Visualizations. 2. R Visualization Quick Start. 3. Customization. 4. Visualize the Distribution of a Categorical Variable. 5. Visualize the Distribution of a Continuous Variable. 6. Visualize the Distributions of Values over Time. 7. Visualize Spatial Data with Maps. 8. Visualize Three Dimensions. 9 Visualize Dimensionality Reduction. 10. Interactive Visualizations.
Es gelten unsere Allgemeinen Geschäftsbedingungen: www.buecher.de/agb
Impressum
www.buecher.de ist ein Internetauftritt der buecher.de internetstores GmbH
Geschäftsführung: Monica Sawhney | Roland Kölbl | Günter Hilger
Sitz der Gesellschaft: Batheyer Straße 115 - 117, 58099 Hagen
Postanschrift: Bürgermeister-Wegele-Str. 12, 86167 Augsburg
Amtsgericht Hagen HRB 13257
Steuernummer: 321/5800/1497