- Gebundenes Buch
- Merkliste
- Auf die Merkliste
- Bewerten Bewerten
- Teilen
- Produkt teilen
- Produkterinnerung
- Produkterinnerung
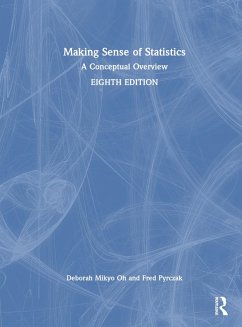
Making Sense of Statistics, Eighth Edition, is the ideal introduction to the concepts of descriptive and inferential statistics for students undertaking their first research project. It presents each statistical concept in a series of short steps, then uses worked examples and exercises to enable students to apply their own learning.
Andere Kunden interessierten sich auch für
![Making Sense of Statistics Making Sense of Statistics]() Deborah M. OhMaking Sense of Statistics44,99 €
Deborah M. OhMaking Sense of Statistics44,99 €![Introduction to the New Statistics Introduction to the New Statistics]() Geoff CummingIntroduction to the New Statistics87,99 €
Geoff CummingIntroduction to the New Statistics87,99 €![Introduction to the New Statistics Introduction to the New Statistics]() Geoff CummingIntroduction to the New Statistics89,99 €
Geoff CummingIntroduction to the New Statistics89,99 €![SPSS Demystified SPSS Demystified]() Ronald D. YockeySPSS Demystified50,99 €
Ronald D. YockeySPSS Demystified50,99 €![Research Methods and Statistics in Psychology Research Methods and Statistics in Psychology]() Hugh Coolican (UK Coventry University)Research Methods and Statistics in Psychology183,99 €
Hugh Coolican (UK Coventry University)Research Methods and Statistics in Psychology183,99 €![Research Methods and Statistics in Psychology Research Methods and Statistics in Psychology]() Hugh Coolican (UK Coventry University)Research Methods and Statistics in Psychology55,99 €
Hugh Coolican (UK Coventry University)Research Methods and Statistics in Psychology55,99 €![Discovering Statistics Using IBM SPSS Statistics Discovering Statistics Using IBM SPSS Statistics]() Andy FieldDiscovering Statistics Using IBM SPSS Statistics58,99 €
Andy FieldDiscovering Statistics Using IBM SPSS Statistics58,99 €-
-
-
Making Sense of Statistics, Eighth Edition, is the ideal introduction to the concepts of descriptive and inferential statistics for students undertaking their first research project. It presents each statistical concept in a series of short steps, then uses worked examples and exercises to enable students to apply their own learning.
Hinweis: Dieser Artikel kann nur an eine deutsche Lieferadresse ausgeliefert werden.
Hinweis: Dieser Artikel kann nur an eine deutsche Lieferadresse ausgeliefert werden.
Produktdetails
- Produktdetails
- Verlag: Taylor & Francis Ltd
- 8 ed
- Seitenzahl: 270
- Erscheinungstermin: 13. Juni 2023
- Englisch
- Abmessung: 282mm x 213mm x 21mm
- Gewicht: 850g
- ISBN-13: 9781032289625
- ISBN-10: 1032289627
- Artikelnr.: 67402196
- Herstellerkennzeichnung
- Libri GmbH
- Europaallee 1
- 36244 Bad Hersfeld
- 06621 890
Deborah Mikyo Oh has been Professor in Research Methods and Statistics at California State University, Los Angeles, USA, since 1998. She earned her PhD from Columbia University, New York, USA, and teaches statistics to a diverse student population at undergraduate, graduate, and doctoral levels.
Introduction: What is Research?; Part A: The Research Context 1. The
Empirical Approach to Knowledge 2. Types of Empirical Research 3. Scales of
Measurement 4. Descriptive, Correlational, and Inferential Statistics;
Part B: Sampling 5. Introduction to Sampling 6. Variations on Random
Sampling 7. Sample Size 8. Standard Error of Mean and Central Limit
Theorem; Part C: Descriptive Statistics 9. Frequencies, Percentages, and
Proportions 10. Shapes of Distributions 11. The Mean: An Average 12. Mean,
Median, and Mode 13. Range and Interquartile Range 14. Standard Deviation
15. Z Score; Part D: Correlational Statistics 16. Correlation 17. Pearson r
18. Scattergram 19. Coefficient of Determination 20. Multiple Correlation;
Part E: Inferential Statistics 21. Introduction to Null Hypothesis 22.
Decisions About the Null Hypothesis 23. Limits of Significance Testing and
Practical Implications; Part F: Means Comparison 24. Introduction to the t
Test 25. Independent Samples t Test 26. Dependent Samples t Test 27. One
Sample t Test 28. Reporting the Results of t Tests: Display of Outcomes 29.
One-Way ANOVA 30. Two-Way ANOVA; Part G: Predictive Significance 31.
Chi-Square 32. Effect Size 33. Simple and Multiple Linear Regressions;
Appendix A. Computations Appendix B. Notes on Interpreting Pearson r and
Linear Regression Appendix C. Table of Random Numbers
Introduction: What is Research?; Part A: The Research Context 1. The Empirical Approach to Knowledge 2. Types of Empirical Research 3. Scales of Measurement 4. Descriptive, Correlational, and Inferential Statistics; Part B: Sampling 5. Introduction to Sampling 6. Variations on Random Sampling 7. Sample Size 8. Standard Error of Mean and Central Limit Theorem; Part C: Descriptive Statistics 9. Frequencies, Percentages, and Proportions 10. Shapes of Distributions 11. The Mean: An Average 12. Mean, Median, and Mode 13. Range and Interquartile Range 14. Standard Deviation 15. Z Score; Part D: Correlational Statistics 16. Correlation 17. Pearson r 18. Scattergram 19. Coefficient of Determination 20. Multiple Correlation; Part E: Inferential Statistics 21. Introduction to Null Hypothesis 22. Decisions About the Null Hypothesis 23. Limits of Significance Testing and Practical Implications; Part F: Means Comparison 24. Introduction to the t Test 25. Independent Samples t Test 26. Dependent Samples t Test 27. One Sample t Test 28. Reporting the Results of t Tests: Display of Outcomes 29. One-Way ANOVA 30. Two-Way ANOVA; Part G: Predictive Significance 31. Chi-Square 32. Effect Size 33. Simple and Multiple Linear Regressions; Appendix A. Computations Appendix B. Notes on Interpreting Pearson r and Linear Regression Appendix C. Table of Random Numbers

