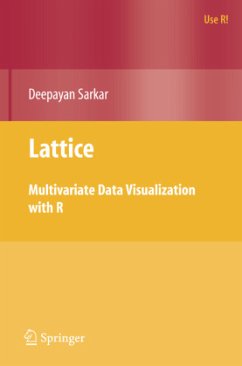
R is rapidly growing in popularity as the environment of choice for data analysis and graphics both in academia and industry. Lattice brings the proven design of Trellis graphics (originally developed for S by William S. Cleveland and colleagues at Bell Labs) to R, considerably expanding its capabilities in the process. Lattice is a powerful and elegant high level data visualization system that is sufficient for most everyday graphics needs, yet flexible enough to be easily extended to handle demands of cutting edge research. Written by the author of the lattice system, this book describes it in considerable depth, beginning with the essentials and systematically delving into specific low levels details as necessary. No prior experience with lattice is required to read the book, although basic familiarity with R is assumed. The book contains close to 150 figures produced with lattice. Many of the examples emphasize principles of good graphical design; almost all use real datasets that are publicly available in various R packages. All code and figures in the book are also available online, along with supplementary material covering more advanced topics.
From the reviews:
"This book can be seen as a valuable source for lattice users at all levels. ... The book nicely shows that making good graphics is a process and the reader is guided by the author in a wealth of examples through the various steps needed to reach the final result. A nice feature of the book is that it has an accompanying homepage that contains all the R code and figures of the book." (Klaus Nordhausen, International Statistical Review, Vol. 76 (3), 2008)
"Lattice is a package for R, and it greatly extends the already impressive graphical capabilities. ... I suggest that many users of lattice (and most users of R probably ought to use lattice) should buy this book. ... if one is using this book for self-study, exercises would be very helpful. ... I recommend this book to anyone with a particular interest in the lattice package or a general interest in R graphics." (Peter L. Flom, The American Statistician, Vol. 63 (1), February, 2009)
"The book has 14 chapters separated in three parts. ... very accessible to those inexperienced in the S language. For those readers that have more experience with R, the book is also quite useful. ... Overall, if you are learning R or have not moved beyond the traditional S graphics system, the book shows the range possibilities of what can be done. ... everyone using R would benefit from this book." (Max Kuhn, Technometrics, Vol. 52 (3), August, 2010)

