Mark Filler, James A. DiGabriele
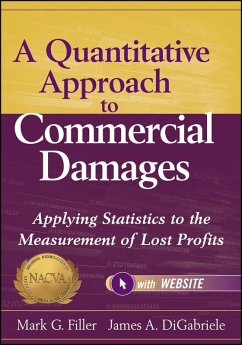
A Quantitative Approach to Commercial Damages, + Website
Applying Statistics to the Measurement of Lost Profits
Mark Filler, James A. DiGabriele
A Quantitative Approach to Commercial Damages, + Website
Applying Statistics to the Measurement of Lost Profits
- Gebundenes Buch
- Merkliste
- Auf die Merkliste
- Bewerten Bewerten
- Teilen
- Produkt teilen
- Produkterinnerung
- Produkterinnerung
How-to guidance for measuring lost profits due to business interruption damages
A Quantitative Approach to Commercial Damages explains the complicated process of measuring business interruption damages, whether they are losses are from natural or man-made disasters, or whether the performance of one company adversely affects the performance of another. Using a methodology built around case studies integrated with solution tools, this book is presented step by step from the analysis damages perspective to aid in preparing a damage claim. Over 250 screen shots are included and key cell…mehr
Andere Kunden interessierten sich auch für
- Darrell D. DorrellFinancial Forensics Body of Knowledge, + Website81,99 €
- Lorenzo CarverVenture Capital Valuation, + Website123,99 €
- James R. HitchnerFinancial Valuation, + Website149,99 €
- George T. GeisSemi-Organic Growth, + Website63,99 €
- David T. EmottPractitioner's Complete Guide to M&as, with Website81,99 €
- Steven E. ShamrockIfrs and Us Gaap, with Website100,99 €
- Joanne M. FloodWiley Revenue Recognition, + Website83,99 €
-
-
-
How-to guidance for measuring lost profits due to business interruption damages
A Quantitative Approach to Commercial Damages explains the complicated process of measuring business interruption damages, whether they are losses are from natural or man-made disasters, or whether the performance of one company adversely affects the performance of another. Using a methodology built around case studies integrated with solution tools, this book is presented step by step from the analysis damages perspective to aid in preparing a damage claim. Over 250 screen shots are included and key cell formulas that show how to construct a formula and lay it out on the spreadsheet.
Includes excel spreadsheet applications and key cell formulas for those who wish to construct their own spreadsheets
Offers a step-by-step approach to computing damages using case studies and over 250 screen shots
Often in the course of business, a firm will be damaged by the actions of another individual or company, such as a fire that shuts down a restaurant for two months. Often, this results in the filing of a business interruption claim. Discover how to measure business losses with the proven guidance found in A Quantitative Approach to Commercial Damages.
Hinweis: Dieser Artikel kann nur an eine deutsche Lieferadresse ausgeliefert werden.
Produktdetails
- Produktdetails
- Verlag: Wiley & Sons
- Artikelnr. des Verlages: 1W118072590
- 1. Auflage
- Seitenzahl: 352
- Erscheinungstermin: 8. Mai 2012
- Englisch
- Abmessung: 260mm x 183mm x 23mm
- Gewicht: 688g
- ISBN-13: 9781118072592
- ISBN-10: 1118072596
- Artikelnr.: 34754863
- Herstellerkennzeichnung
- Produktsicherheitsverantwortliche/r
- Europaallee 1
- 36244 Bad Hersfeld
- gpsr@libri.de
MARK G. FILLER, CPA/ABV, CBA, AM, CVA, is President of Filler & Associates, a valuation and litigation support practice. He recently was also chair of the editorial board of NACVA's The Valuation Examiner and coauthor of NACVA's quarterly marketing newsletter Insights on Valuation. Filler has published various articles and is recognized as a qualified expert witness, testifying frequently on business valuation, commercial damages, and personal injury matters at depositions and in state and federal courts. JAMES A. DIGABRIELE, PHD/DPS, CPA/ABV, CFF, CFE, CFSA, CR.FA, CVA, is a professor of accounting at Montclair State University and has been published in various journals, including Journal of Forensic Accounting, Journal of Business Valuation and Economic Loss Analysis, and The Value Examiner. Dr. DiGabriele is also Managing Director of DiGabriele, McNulty, Campanella & Co., LLC, an accounting firm specializing in forensic/investigative accounting and litigation support.
Preface xvii
Is This a Course in Statistics? xvii
How This Book is Set Up xviii
The Job of the Testifying Expert xix
About the Companion Web Site-Spreadsheet Availability xix
Note xx
Acknowledgments xxi
Introduction The Application of Statistics to the Measurement of Damages
for Lost Profits 1
The Three Big Statistical Ideas 1
Variation 1
Correlation 2
Rejection Region or Area 4
Introduction to the Idea of Lost Profits 6
Stage 1. Calculating the Difference Between Those Revenues That Should Have
Been Earned and What Was Actually Earned During the Period of Interruption
7
Stage 2. Analyzing Costs and Expenses to Separate Continuing from
Noncontinuing 8
Stage 3. Examining Continuing Expenses Patterns for Extra Expense 8
Stage 4. Computing the Actual Loss Sustained or Lost Profits 8
Choosing a Forecasting Model 9
Type of Interruption 9
Length of Period of Interruption 10
Availability of Historical Data 10
Regularity of Sales Trends and Patterns 10
Ease of Explanation 10
Conventional Forecasting Models 11
Simple Arithmetic Models 11
More Complex Arithmetic Models 11
Trendline and Curve-Fitting Models 12
Seasonal Factor Models 12
Smoothing Methods 12
Multiple Regression Models 13
Other Applications of Statistical Models 14
Conclusion 14
Notes 15
Chapter 1 Case Study 1-Uses of the Standard Deviation 17
The Steps of Data Analysis 17
Shape 18
Spread 19
Conclusion 23
Notes 23
Chapter 2 Case Study 2-Trend and Seasonality Analysis 25
Claim Submitted 25
Claim Review 26
Occupancy Percentages 26
Trend, Seasonality, and Noise 28
Trendline Test 33
Cycle Testing 33
Conclusion 34
Note 36
Chapter 3 Case Study 3-An Introduction to Regression Analysis and Its
Application to the Measurement of Economic Damages 37
What is Regression Analysis and Where Have I Seen It Before? 37
A Brief Introduction to Simple Linear Regression 38
I Get Good Results with Average or Median Ratios-Why Should I Switch to
Regression Analysis? 40
How Does One Perform a Regression Analysis Using Microsoft Excel? 43
Why Does Simple Linear Regression Rarely Give Us the Right Answer, and What
Can We Do about It? 51
Should We Treat the Value Driver Annual Revenue in the Same Manner as We
Have Seller's Discretionary Earnings? 60
What are the Meaning and Function of the Regression Tool's Summary Output?
68
Regression Statistics 69
Tests and Analysis of Residuals 75
Testing the Linearity Assumption 77
Testing the Normality Assumption 78
Testing the Constant Variance Assumption 80
Testing the Independence Assumption 83
Testing the No Errors-in-Variables Assumption 84
Testing the No Multicollinearity Assumption 84
Conclusion 87
Note 87
Chapter 4 Case Study 4-Choosing a Sales Forecasting Model: A Trial and
Error Process 89
Correlation with Industry Sales 89
Conversion to Quarterly Data 89
Quadratic Regression Model 92
Problems with the Quarterly Quadratic Model 92
Substituting a Monthly Quadratic Model 94
Conclusion 95
Note 99
Chapter 5 Case Study 5-Time Series Analysis with Seasonal Adjustment 101
Exploratory Data Analysis 101
Seasonal Indexes versus Dummy Variables 102
Creation of the Optimized Seasonal Indexes 103
Creation of the Monthly Time Series Model 108
Creation of the Composite Model 108
Conclusion 115
Notes 115
Chapter 6 Case Study 6-Cross-Sectional Regression Combined with Seasonal
Indexes to Determine Lost Profits 117
Outline of the Case 117
Testing for Noise in the Data 119
Converting to Quarterly Data 119
Optimizing Seasonal Indexes 119
Exogenous Predictor Variable 124
Interrupted Time Series Analysis 124
"But For" Sales Forecast 126
Transforming the Dependent Variable 130
Dealing with Mitigation 130
Computing Saved Costs and Expenses 133
Conclusion 137
Note 138
Chapter 7 Case Study 7-Measuring Differences in Pre- and Postincident Sales
Using Two Sample t-Tests versus Regression Models 139
Preliminary Tests of the Data 139
Using the t-Test Two Sample Assuming Unequal Variances Tool 141
Regression Approach to the Problem 141
A New Data Set-Different Results 143
Selecting the Appropriate Regression Model 143
Finding the Facts Behind the Figures 148
Conclusion 151
Notes 153
Chapter 8 Case Study 8-Interrupted Time Series Analysis, Holdback
Forecasting, and Variable Transformation 155
Graph Your Data 155
Industry Comparisons 155
Accounting for Seasonality 157
Accounting for Trend 161
Accounting for Interventions 161
Forecasting "Should Be" Sales 164
Testing the Model 167
Final Sales Forecast 169
Conclusion 169
Chapter 9 Case Study 9-An Exercise in Cost Estimation to Determine Saved
Expenses 171
Classifying Cost Behavior 171
An Arbitrary Classification 172
Graph Your Data 172
Testing the Assumption of Significance 174
Expense Drivers 174
Conclusion 177
Chapter 10 Case Study 10-Saved Expenses, Bivariate Model Inadequacy, and
Multiple Regression Models 179
Graph Your Data 179
Regression Summary Output of the First Model 181
Search for Other Independent Variables 183
Regression Summary Output of the Second Model 185
Conclusion 188
Chapter 11 Case Study 11-Analysis of and Modification to Opposing Experts'
Reports 189
Background Information 189
Stipulated Facts and Data 190
The Flaw Common to Both Experts 194
Defendant's Expert's Report 196
Plaintiff's Expert's Report 199
The Modified-Exponential Growth Curve 201
Four Damages Models 208
Conclusion 208
Chapter 12 Case Study 12-Further Considerations in the Determination of
Lost Profits 209
A Review of Methods of Loss Calculation 210
A Case Study: Dunlap Drive-In Diner 211
Skeptical Analysis Using the Fraud Theory Approach 212
Revenue Adjustment 212
Officer's Compensation Adjustment 214
Continuing Salaries and Wages (Payroll) Adjustment 215
Rent Adjustment 215
Employee Bonus 216
Discussion 216
Conclusion 217
Chapter 13 Case Study 13-A Simple Approach to Forecasting Sales 221
Month Length Adjustment 221
Graph Your Data 221
Worksheet Setup 222
First Forecasting Method 227
Second Forecasting Method 227
Selection of Length of Prior Period 228
Reasonableness Test 228
Conclusion 229
Chapter 14 Case Study 14-Data Analysis Tools for Forecasting Sales 231
Need for Analytical Tests 231
Graph Your Data 231
Statistical Procedures 233
Tests for Randomness 235
Tests for Trend and Seasonality 240
Testing for Seasonality and Trend with a Regression Model 246
Conclusion 249
Notes 249
Chapter 15 Case Study 15-Determining Lost Sales with Stationary Time Series
Data 251
Prediction Errors and Their Measurement 251
Moving Averages 252
Array Formulas 254
Weighted Moving Averages 256
Simple Exponential Smoothing 260
Seasonality with Additive Effects 263
Seasonality with Multiplicative Effects 268
Conclusion 272
Chapter 16 Case Study 16-Determining Lost Sales Using Nonregression Trend
Models 273
When Averaging Techniques are Not Appropriate 273
Double Moving Average 275
Double Exponential Smoothing (Holt's Method) 277
Triple Exponential Smoothing (Holt-Winter's Method) for Additive Seasonal
Effects 279
Triple Exponential Smoothing (Holt-Winter's Method) for Multiplicative
Seasonal Effects 285
Conclusion 288
Appendix The Next Frontier in the Application of Statistics 291
The Technology 291
EViews 291
Minitab 292
NCSS 292
The R Project for Statistical Computing 293
SAS 294
SPSS 295
Stata 296
WINKS SDA 7 Professional 298
Conclusion 299
Bibliography of Suggested Statistics Textbooks 301
Glossary of Statistical Terms 303
About the Authors 317
Index 319