Michel Larini, Angela Barthes
Quantitative and Statistical Data in Education
From Data Collection to Data Processing
Michel Larini, Angela Barthes
Quantitative and Statistical Data in Education
From Data Collection to Data Processing
- Gebundenes Buch
- Merkliste
- Auf die Merkliste
- Bewerten Bewerten
- Teilen
- Produkt teilen
- Produkterinnerung
- Produkterinnerung
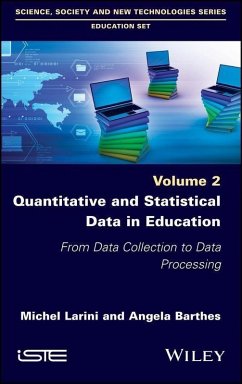
This book presents different data collection and representation techniques: elementary descriptive statistics, confirmatory statistics, multivariate approaches and statistical modeling. It exposes the possibility of giving more robustness to the classical methodologies of education sciences by adding a quantitative approach. The fundamentals of each approach and the reasons behind them are methodically analyzed, and both simple and advanced examples are given to demonstrate how to use them. Subsequently, this book can be used both as a course for the uninitiated and as an accompaniment for researchers who are already familiar with these concepts.…mehr
Andere Kunden interessierten sich auch für
- Statistical Topics and Stochastic Models for Dependent Data with Applications190,99 €
- Quantitative Data Analysis for Language Assessment Volume I201,99 €
- Michael BoyleApplied Communication Research Methods198,99 €
- Patrick BahlsWriting in the Quantitative Di47,99 €
- Paul J. BlommersElementary Statistical Methods in Psychology and Education92,99 €
- The Reviewer's Guide to Quantitative Methods in the Social Sciences319,99 €
- Josephine P. ManapsalImproving Inquiry-Based Skills in Quantitative Research for Grade 12 Students. Developing a Localized and Contextualized Module11,95 €
-
-
-
This book presents different data collection and representation techniques: elementary descriptive statistics, confirmatory statistics, multivariate approaches and statistical modeling. It exposes the possibility of giving more robustness to the classical methodologies of education sciences by adding a quantitative approach. The fundamentals of each approach and the reasons behind them are methodically analyzed, and both simple and advanced examples are given to demonstrate how to use them. Subsequently, this book can be used both as a course for the uninitiated and as an accompaniment for researchers who are already familiar with these concepts.
Hinweis: Dieser Artikel kann nur an eine deutsche Lieferadresse ausgeliefert werden.
Produktdetails
- Produktdetails
- Verlag: Wiley
- Seitenzahl: 304
- Erscheinungstermin: 18. Dezember 2018
- Englisch
- Abmessung: 239mm x 157mm x 23mm
- Gewicht: 567g
- ISBN-13: 9781786302281
- ISBN-10: 1786302284
- Artikelnr.: 52417761
- Herstellerkennzeichnung
- Libri GmbH
- Europaallee 1
- 36244 Bad Hersfeld
- 06621 890
- Verlag: Wiley
- Seitenzahl: 304
- Erscheinungstermin: 18. Dezember 2018
- Englisch
- Abmessung: 239mm x 157mm x 23mm
- Gewicht: 567g
- ISBN-13: 9781786302281
- ISBN-10: 1786302284
- Artikelnr.: 52417761
- Herstellerkennzeichnung
- Libri GmbH
- Europaallee 1
- 36244 Bad Hersfeld
- 06621 890
Michel Larini is Professor Emeritus at Aix-Marseille University, France, and has a doctorate in Mathematical Sciences. Angela Barthes is Professor in Education Sciences at Aix-Marseille University, France. She has two doctorates, in Physical Sciences and Geography.
Introduction ix Chapter 1 Data Collection in Education 1 1.1 Use of existing databases in education 1 1.1.1 International databases 2 1.1.2 Compound databases 3 1.2 Survey questionnaire 4 1.2.1 Objective of a questionnaire 4 1.2.2 Constitution of the sample 4 1.2.3 Questions 7 1.2.4 Structure of a questionnaire 8 1.2.5 Writing 9 1.3 Experimental approaches 10 1.3.1 Inductive and deductive approaches 10 1.3.2 Experimentation by psychologists 11 1.3.3 Experimentation in education 11 Chapter 2 Elementary Descriptive Statistics and Data Representation 15 2.1 Tables and graphic representations 15 2.1.1 Population, sample and individuals 15 2.1.2 Variables 16 2.1.3 Tables 18 2.1.4 Graphic representations 23 2.2 Mathematical indicators 29 2.2.1 General points 29 2.2.2 Some fundamentals of mathematical language 29 2.2.3 Monovariate mathematical indicators 32 2.2.4 Bivariate mathematical indicators 37 2.3 Spatial data representation methods 41 2.3.1 Maps to understand the geography of educational phenomena 41 2.3.2 Statistical data represented on a map 42 2.3.3 Range-based and point-based maps 43 2.3.4 Other maps 45 2.3.5 Geographic information systems 46 2.3.6 Specific map-analysis methods 46 Chapter 3 Confirmatory Statistics 49 3.1 Law of random chance and law of large numbers: hypothesis tests 50 3.1.1 General points 50 3.1.2 Probability laws 51 3.1.3 Hypothesis tests 76 3.2 Tests on means: Student's tests 81 3.2.1 General 81 3.2.2 Comparison of a mean and a norm 81 3.2.3 Comparison of two observed means 92 3.2.4 What we have learned 97 3.2.5 Implementation of tests: use of software 98 3.3 Analysis of variance 99 3.3.1 General points 99 > 2 independent samples 100 > 2 matched samples: repeated measurement ANOVA 110 3.4 Bivariate analysis: Bravais-Pearson correlation test 111 3.4.1 General points 111 3.4.2 Bravais-Pearson test 112 3.4.3 Pitfalls in using linear tests 114 3.4.4 Example of calculation 115 3.5. Confirmatory tests for qualitative variables:
2 and frequency comparison 118 3.5.1 General points 118 3.5.2 Presentation of a
2 test: the "loaded die" 119 3.5.3 Fitting
2 test: general formulation 124 3.5.4
2 tests of the independence of two variables 126 3.5.5 Sample equality tests 133 3.5.6 Intensity of the link between variables: Cramer's V 139 Chapter 4 Multivariate Analyses 141 4.1 Principal component analysis 142 4.1.1 Overview 142 4.1.2 Bivariate approach 142 4.1.3 PCA 3D 154 4.1.4 4D examples 162 4.1.5 Another example: study of "graduation from school" in nine European countries 167 4.2 Factorial correspondence analyses 173 4.2.1 Overview 173 4.2.2 Factorial correspondence analysis 173 4.2.3 Factorial multiple correspondence analysis 186 Chapter 5 Statistical Modeling 193 5.1 Simple bivariate linear modeling 194 5.1.1 Problem statement 194 5.1.2 Determining the regression line in the population 195 5.1.3 Quality of representation: confidence and prediction interval 201 5.1.4 Explanatory power of the model 207 5.2 Multiple linear regressions for quantitative explanatory variables 209 5.2.1 Overview 209 5.2.2 Example: graduation from school 211 5.2.3 Progressive development of a multivariate model 215 5.3 Modeling with qualitative explanatory variables 216 5.3.1 Quantitative explanatory variable and dichotomous qualitative variable 216 5.3.2 Quantitative explanatory variable and polytomous qualitative variable 219 5.4 Considering interactions between variables 220 5.4.1 Overview 220 5.4.2 Quantitative variable and dichotomous qualitative variable 220 5.4.3 Other types of interactions 221 5.5 Complex modeling 223 5.5.1 Nonlinear modeling 223 5.5.2 Multilevel approach 226 5.5.3 Logistic regression 227 Chapter 6 Toward the Robustness in Studies in Education by the Quantitative Approach 229 6.1 Quantitative approach to social representations in education 229 6.1.1 Methodological milestones of a quantitative approach to social representations 230 6.1.2 Choice of study corpora, questionnaires and interviews 232 6.1.3 Graphical representation methods 233 6.1.4 Analytical model for explicitation of ideological loads 237 6.1.5 Comparative analytical model 241 6.1.6 Case study 242 6.2 Example of a quantitative approach to relationships to knowledge 248 6.2.1 From the theory of relationships to knowledge to the definition of variables 248 6.2.2 From the definition of variables to quantitative tools 252 6.2.3 Case study of heritage education 254 6.2.4 Conduct a quantitative study of relationships to knowledge 256 References 267 Index 273