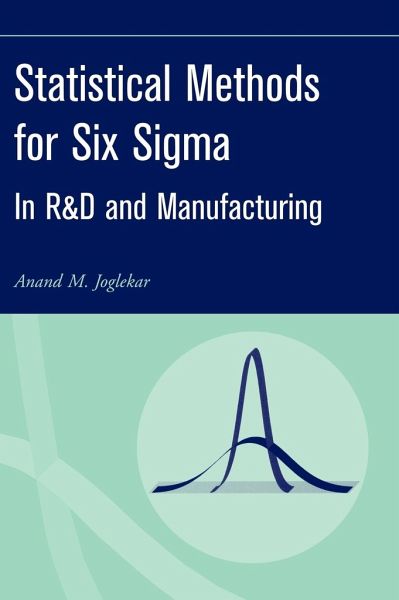
Statistical Methods for Six SIGMA
In R&d and Manufacturing

PAYBACK Punkte
80 °P sammeln!

A guide to achieving business successes through statistical methodsStatistical methods are a key ingredient in providing data-based guidance to research and development as well as to manufacturing. Understanding the concepts and specific steps involved in each statistical method is critical for achieving consistent and on-target performance.Written by a recognized educator in the field, Statistical Methods for Six Sigma: In R&D and Manufacturing is specifically geared to engineers, scientists, technical managers, and other technical professionals in industry. Emphasizing practical learning, ap...
A guide to achieving business successes through statistical methods
Statistical methods are a key ingredient in providing data-based guidance to research and development as well as to manufacturing. Understanding the concepts and specific steps involved in each statistical method is critical for achieving consistent and on-target performance.
Written by a recognized educator in the field, Statistical Methods for Six Sigma: In R&D and Manufacturing is specifically geared to engineers, scientists, technical managers, and other technical professionals in industry. Emphasizing practical learning, applications, and performance improvement, Dr. Joglekar's text shows today's industry professionals how to:
_ Summarize and interpret data to make decisions
_ Determine the amount of data to collect
_ Compare product and process designs
_ Build equations relating inputs and outputs
_ Establish specifications and validate processes
_ Reduce risk and cost-of-process control
_ Quantify and reduce economic loss due to variability
_ Estimate process capability and plan process improvements
_ Identify key causes and their contributions to variability
_ Analyze and improve measurement systems
This long-awaited guide for students and professionals in research, development, quality, and manufacturing does not presume any prior knowledge of statistics. It covers a large number of useful statistical methods compactly, in a language and depth necessary to make successful applications. Statistical methods in this book include: variance components analysis, variance transmission analysis, risk-based control charts, capability and performance indices, quality planning, regression analysis, comparative experiments, descriptive statistics, sample size determination, confidence intervals, tolerance intervals, and measurement systems analysis. The book also contains a wealth of case studies and examples, and features a unique test to evaluate the reader's understanding of the subject.
Statistical methods are a key ingredient in providing data-based guidance to research and development as well as to manufacturing. Understanding the concepts and specific steps involved in each statistical method is critical for achieving consistent and on-target performance.
Written by a recognized educator in the field, Statistical Methods for Six Sigma: In R&D and Manufacturing is specifically geared to engineers, scientists, technical managers, and other technical professionals in industry. Emphasizing practical learning, applications, and performance improvement, Dr. Joglekar's text shows today's industry professionals how to:
_ Summarize and interpret data to make decisions
_ Determine the amount of data to collect
_ Compare product and process designs
_ Build equations relating inputs and outputs
_ Establish specifications and validate processes
_ Reduce risk and cost-of-process control
_ Quantify and reduce economic loss due to variability
_ Estimate process capability and plan process improvements
_ Identify key causes and their contributions to variability
_ Analyze and improve measurement systems
This long-awaited guide for students and professionals in research, development, quality, and manufacturing does not presume any prior knowledge of statistics. It covers a large number of useful statistical methods compactly, in a language and depth necessary to make successful applications. Statistical methods in this book include: variance components analysis, variance transmission analysis, risk-based control charts, capability and performance indices, quality planning, regression analysis, comparative experiments, descriptive statistics, sample size determination, confidence intervals, tolerance intervals, and measurement systems analysis. The book also contains a wealth of case studies and examples, and features a unique test to evaluate the reader's understanding of the subject.
Andere Kunden interessierten sich für