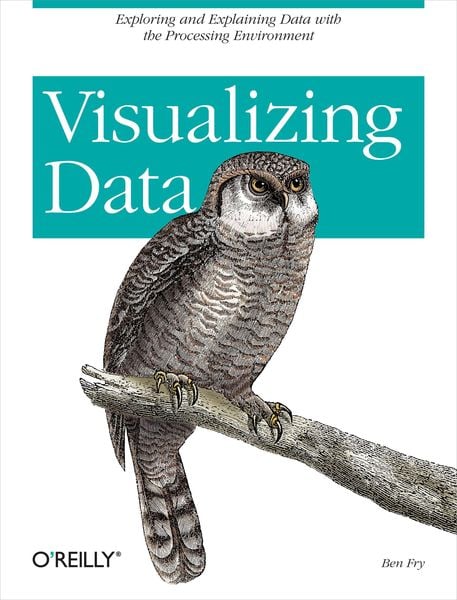
Visualizing Data Exploring and Explaining Data with the Processing Environment
-
- Taschenbuch ausgewählt
- eBook
-
Sprache:Englisch
34,99 €
inkl. gesetzl. MwSt.,
Beschreibung
Produktdetails
Einband
Taschenbuch
Erscheinungsdatum
22.01.2008
Abbildungen
w. figs.
Verlag
O'Reilly MediaSeitenzahl
382
Maße (L/B/H)
23,2/17,9/2,5 cm
Gewicht
721 g
Sprache
Englisch
ISBN
978-0-596-51455-6
How do the 3.1 billion A, C, G and T letters of the human genome compare to those of a chimp or a mouse? What do the paths that millions of visitors take through a web site look like? With Visualizing Data, you learn how to answer complex questions like these with thoroughly interactive displays. We're not talking about cookie-cutter charts and graphs. This book teaches you how to design entire interfaces around large, complex data sets with the help of a powerful new design and prototyping tool called "Processing".
Used by many researchers and companies to convey specific data in a clear and understandable manner, the Processing beta is available free. With this tool and Visualizing Data as a guide, you'll learn basic visualization principles, how to choose the right kind of display for your purposes, and how to provide interactive features that will bring users to your site over and over. This book teaches you:
The seven stages of visualizing data -- acquire, parse, filter, mine, represent, refine, and interact
How all data problems begin with a question and end with a narrative construct that provides a clear answer without extraneous details
Several example projects with the code to make them work
Positive and negative points of each representation discussed. The focus is on customization so that each one best suits what you want to convey about your data set
The book does not provide ready-made "visualizations" that can be plugged into any data set. Instead, with chapters divided by types of data rather than types of display, you'll learn how each visualization conveys the unique properties of the data it represents -- why the data was collected, what's interesting about it, and what stories it can tell. Visualizing Data teaches you how to answer questions, not simply display information.
Noch keine Bewertungen vorhanden
Verfassen Sie die erste Bewertung zu diesem Artikel
Helfen Sie anderen Kundinnen und Kunden durch Ihre Meinung.
Kurze Frage zu unserer Seite
Vielen Dank für dein Feedback
Wir nutzen dein Feedback, um unsere Produktseiten zu verbessern. Bitte habe Verständnis, dass wir dir keine Rückmeldung geben können. Falls du Kontakt mit uns aufnehmen möchtest, kannst du dich aber gerne an unseren Kund*innenservice wenden.
zum Kundenservice